Aritzia (TSE: ATZ) - Strong brand at an attractive valuation - Company Deep Dive
Intrinsic Value Estimate as of January 2023
Thank you for being a subscriber! Today, we are taking a deep dive into Aritzia Inc. We look at the history of Aritzia, study its brand, analyze its historical financial performance, review management & governance and finally estimate its intrinsic value. But since I know that not everyone has the the time to read 5,000 words, here is a quick 2-minute summary:
Summary Deep Dive:
Aritzia Inc. (TSE: ATZ, “Aritzia”) is a women’s apparel company which operates 115 boutiques in Canada and the United States. The company is headquartered in Vancouver, Canada. As of January 27, 2023, Aritzia had a market capitalization of $5,220 million and FY2022 revenues of $1,495 million.
Aritzia operates as a design house which has several different in-house brands which are sold through its stores and artizia.com. Aritzia currently sells its products under 10 main brands, that are, Babaton, Ten by Babaton, Wilfred, Wilfred free, Tna, TnAction, Super World (Super Puff), Sunday Best, Reigning Champ and Denim Forum. Aritzia’s products are priced at a premium and are positioned as ‘Everyday Luxury’.
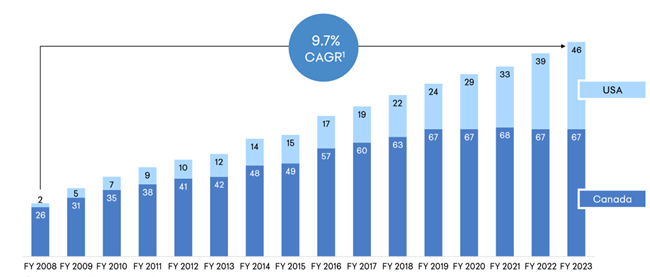
From FY2008 to FY2023, Aritzia grew its store count from 28 stores to 115 stores as of November 2022 as at compounded annual growth rate (“CAGR”) of 10%. Aritzia has 67 stores in Canada and 48 stores in the U.S. Its average store size is 8,000 square feet; however, flagship stores are often as big as 14,500 square feet.
Driven by the move to online during the pandemic, Aritzia’s eCommerce has grown from 12% of revenue in 2016 at the time of IPO, to 35% of revenues currently.
Aritzia has attractive store level economics. A new store typical costs $3 million in net investment of capex and inventory. The company generally makes revenue of $1,000 per sq. ft. in the first few years of operation. At an average store size of 8,000 sq. ft., this comes to annual revenue of $8 million per store. The payback period of new stores is between 12 to 18 months translating to an EBITDA margin of 30% per store, and a return on invested capital (“ROIC”) of 80% at store level.
Management is highly experienced and has healthy ownership in Aritzia. Management’s interests are aligned with shareholder in terms of compensation (Performance Stock Units are linked to revenue and EPS). Management has met its 5-year financial performance goals even with the challenges posed by the pandemic. Board of directors are experienced fashion industry professionals and private equity professionals.
Management has been good at capital allocation, with consistent share buybacks and reinvestment with a single caveat on small acquisition of men’s wear brand.
Based on our discounted cash flow model, we estimate that Aritzia’s intrinsic value per share is $65. This represents an upside of 36% from the current share price of $47.3 as of January 27, 2023.
Disclaimer: Fairway Research is currently long Aritzia shares. This report is only for educational purposes and is not meant to be investment advice. Readers should do their own due diligence before investing.
I understand that since this is a long report, some readers might want to take a print out and just mark-up notes using a PDF. I hear you - you can download the PDF below.
Rest of this report is divided into the following sections:
Introduction
Brief History of Aritzia
Understanding Aritzia’s brand: 5 key pillars
Historical revenue growth and store level economics
Historical financial performance
Management performance and governance
Valuation summary
A. Introduction
Aritzia Inc. (TSE: ATZ, “Aritzia”) is a women’s apparel company which operates 115 boutiques in Canada and the United States. The company is headquartered in Vancouver, Canada and was founded in 1984 by Brian Hill, a third-generation retailer.
As of January 27, 2023, Aritzia had a market capitalization of $5,220 million and FY2022 revenues of $1,495 million.
B. Brief history of Aritzia
Aritzia opened its first stores outside of Vancouver in 1999. In 2005, the private equity firm Berkshire Partners took a majority stake in Aritzia and are still present on the board of directors of the company.
In 2007 Aritzia launched its first store in the United States which has now become the largest geographic market for the firm’s products. Its eCommerce website was launched in 2012 and it started shipping its product internationally in 2016. With 74 boutiques open in Canada and the U.S., and a revenue of $542 million in FY2016, Aritzia went for an IPO in 2016 and started trading on the Toronto Stock Exchange. Interestingly, up to 2016, Aritzia had never closed a store in its 32-year history. Aritzia faced a challenging year in FY2021 when Covid-19 led to closure of several of its stores across the U.S. and Canada. However, Aritzia quickly pivoted its business and inventory to focus on online fulfillment and saw exponential eCommerce revenue growth FY2021 and FY2022.

C. Understanding Aritzia’s Brand: 5 key pillars
To understand Aritzia’s business we need understand its brand. And to understand its brand we need to dig into, what we believe are five key brand pillars:
1. Product strategy;
2. Pricing;
3. Stores / Boutiques;
4. Ecommerce; and
5. Marketing.
Pillar 1: Product Strategy
Aritzia operates as a design house with several different in-house brands which are sold through its stores. Aritzia currently sells its products through 10 main brands, that are, Babaton, Ten by Babaton, Wilfred, Wilfred free, Tna, TnAction, Super World (Super Puff), Sunday Best, Reigning Champ and Denim Forum. Aritzia derives 95% of its revenue from these inhouse brands. The remaining 5% of revenue comes of sales of third party branded products such as sneakers (Vans, New Balance).
The company’s primary target market are women between the age of 15 and 45. The brands under Aritzia keep on evolving over time as new ones are introduced in line with current trends. See below the evolution of Aritzia’s primary brands from 2016 to 2022:
As can be seen in Figure 2, over the last six years, Aritzia introduced brands such as TnAction, Super World, Sunday best, Denim Forum and Ten by Babaton. It also continuously introduces various sub brands under its successful brands such as TNA, Babaton and Wilfred. Each brand is treated as a separate label with its own dedicated in-house design team.
The multi brand portfolio and product mix allows enhanced multiple flexibility to address evolving fashion trends, appeal to customers across multiple life stages and style preferences. This also increases the customer base and share of customer’s closet for Aritzia. During the pandemic, the stay-at-home orders led to a decrease in Aritzia’s sales of its professional wear brand Babaton. The company had the flexibility to push other brands which had a more stay-at-home and casual product line.


Pillar 2: Pricing
Aritzia’s products are priced at a premium and are positioned as ‘Everyday Luxury’. Management claims to have lower mark downs of inventory owing to its superior sourcing and inventory management. Aritzia also tends to take a long-term view of brand management and often foregoes short term sales by discontinuing older styles and introducing new ones to maintain brand relevance.
Aritzia’s products are only sold in their stores and on Aritzia.com. The company does not have a third-party wholesale channel for their products.
“Depending on the item, Aritzia pieces can run on the average to higher end of the price spectrum. In my opinion, if you’re shopping for a classic coat, a pair of pants you know you’ll get a lot of wear out of, a dress, etc., you’re likely paying a good price for the quality.”- Anna Baun
https://www.alilyloveaffair.com/aritzia-review.html
Pillar 3: Boutiques / Stores
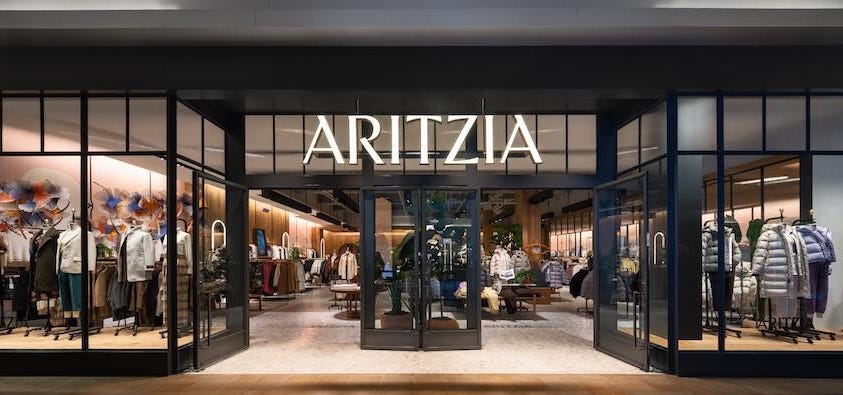
The crucial aspect of Aritzia’s brand are its stores. I like comparing Aritzia’s store experience to that of Starbucks for coffee. Its stores are meant to be experiential. They have a curated mix of store design, architecture and music. The retail channel contributes 65% of Aritzia’s revenue.
“Trying on clothes is also different. Most stores don't have mirrors inside the dressing rooms, and instead have communal ones that require customers to step into a public area to see how items fit. This promotes more interaction with associates to help with styling and recommending additional products” – Forbes1
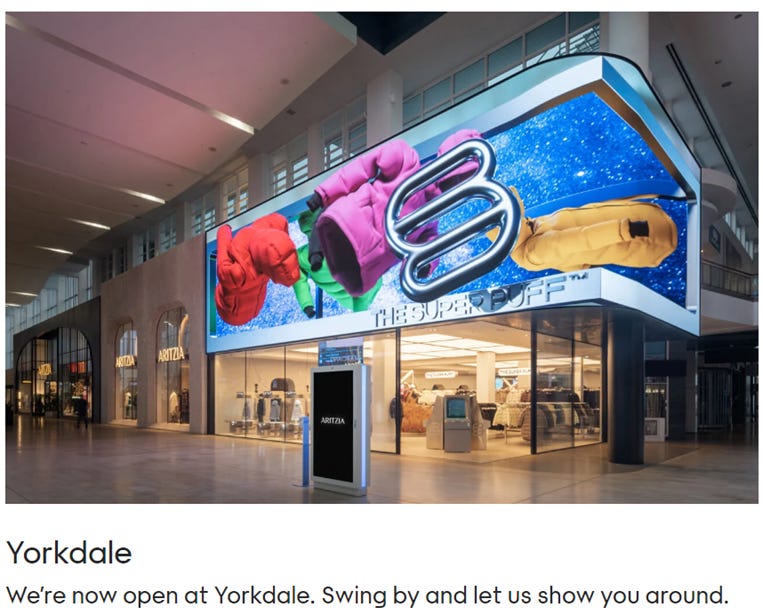
Aritzia’s currently has 115 stores as of November 2022[1]. 67 of those stores are in Canada and 48 are in the US. Its average store size is 8000 square feet; however, their flagship stores are often as big as 14,500 square feet. The boutiques are primarily launched under the Aritzia brand; however, the company opportunistically opens standalone stores under the TNA, Babaton and Super Puff brands. Aritzia’s stores are in either high traffic malls, or high street locations with heavy footfall. The company treats its stores as its main customer acquisition vehicle and major component of its marketing strategy. To elevate the customer experience, some of the stores even have a A-ok café in store. Again, taking its long-term approach to brand management, Aritzia’s management is often willing to wait for the right retail locations which resonate with its brand.
Pillar 4: eCommerce
Aritzia started its eCommerce segment in 2012. It started shipping to international customers in 2016. It currently ships to over 200 countries. Aritzia’s eCommerce business is supported by its concierge team who are often its own former retail store associates. As per the management, whenever a store is opened in a new market, it results in 80% uptick in ecommerce revenue in that area. So essentially both online and retail divisions feed from other in the synergistic manner. Aritzia’s eCommerce division only contributed 12% of revenue in FY2016 at the time of IPO. However, the pandemic supercharged the division, and it now stands at 35% of revenues. As per similar web, the Aritzia.com saw monthly traffic of over 10 million visits during December 2022.
“With every new market, eCommerce is expected to grow substantially. We are seeing an average lift of 80% in eCommerce when we open a boutique in a new market.”- Aritzia investor day, October 2022
Aritzia’s products are packed aesthetically pleasing packaging adding to the entire online shopping experience. Management as claimed that Aritzia’s omni channel customers, generally spend 3x the amount spent by single channel (eCommerce or retail) customers.
Pillar 5: Marketing
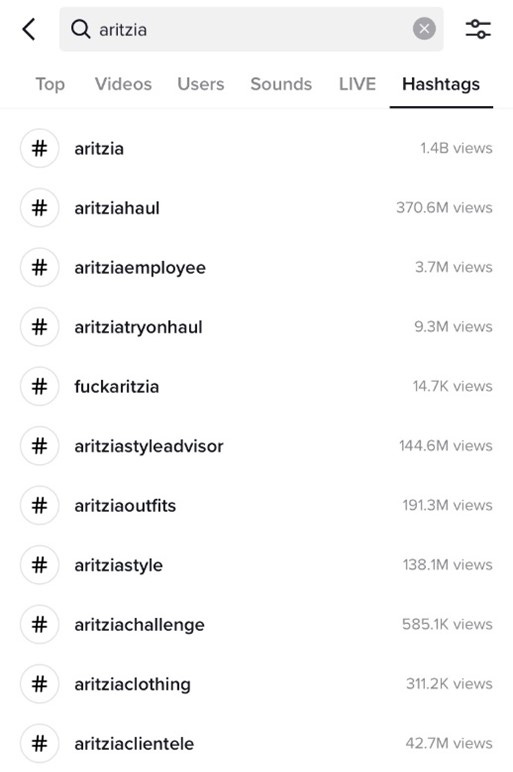
The last pillar of Aritzia’s brand is its marketing strategy. The company does not use traditional media to promote its products. In addition to relying on its physical stores, the company primarily engages social media influencers to promote its products. The brand is also further flued by its popularity among its customers who like posting about their shopping experiences (shopping hauls) on social media platforms such as TikTok where Aritzia has almost 2 billion views. Aritzia’s minimalist store set up is appealing to influencers. In addition to a very active reddit discussion group, Aritzia also has over 1.4 million followers on Instagram. As per Google trends, the search interest in Aritzia has been steadily increasing over the year. It peaks every year around the holiday season. Online interest in Aritzia has been especially strong in 2021 and 2022 (See Figure 9).
“Aritzia’s clothes are simple but effective on TikTok, where the retailer has carved out a corner of the app.” – Maura Brannigan, Voguebusiness.com
D. Historical revenue growth and store level economics
In this section we will dive into Aritzia’s historical store growth, and its store level economics both for new stores and expanded stores which are a key component of Aritzia’s strategy.
Historical store growth
Aritzia has grown its store count from 28 in FY2008 to 115 as of November 2022 as at annual compounded annual growth rate (“CAGR”) of around 10%. It currently has 67 stores in Canada and 48 stores in the US. Store growth in its home market of Canada has stagnated since FY2019 and most of the growth is coming from the US where is a relatively newer brand.
Between FY2018 and FY2022, Aritzia opened between 5 to 6 new stores each year (27 in total). Further, it also expanded the square footage in 23 of its existing stores during the same period while closing only one store in FY2022.
Store level economics: new stores
Aritzia’s new store economics are very attractive in terms of return on invested capital. A new store typical costs $3 million in net investment of capex and inventory. The company generally makes revenue of $1,000 per sq. ft. in the first few years of operation. At an average store size of 8,000 sq. ft., this comes to annual revenue of $8 million per store. The payback period of new stores is between 12 to 18 months. That translates into an EBITDA margin of 30% per store, and a return on invested capital (“ROIC”) of 80% for every new store. As discussed previously, new stores also lead to 80% uptick in ecommerce sales. That increase is not factored into in the new store economics, so ROIC can be effectively higher than 80%.
Store level economics: Existing store expansion
Aritzia’s store expansion generally involve increasing the existing selling space by 3,500 square feet. The net investment for the expansion is $2 million and a payback period of around 24 months.
Overall revenue growth
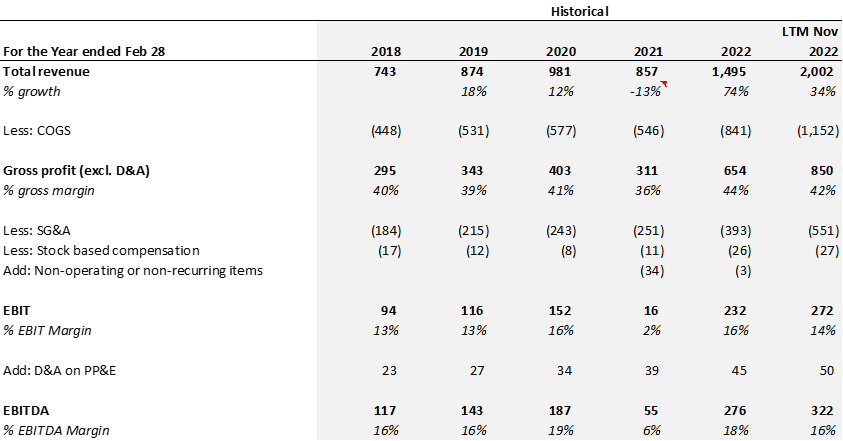
Aritzia’s revenue grew from $743 million in FY2018 to $2,002 million for the last twelve months (“LTM”) ended November 2022 at a CAGR of 22%. Out of its total revenue of $2,002 million, $1,325 million (or 66%) was from the retail segment and $677 million (or 34%) was from eCommerce segment.
Retail revenue
At 115 stores, the retail revenue of $1,325 million represents average annual revenue per store of $11.5 million. Note that the revenue level of $1,000 per sq. ft. considered in Figure 12 is for new stores. As stores mature, their revenue per sq. ft. increases. Given that the average size of an Aritzia store is 8,000 sq. ft., the revenue per store of $11.5 million translates to revenue per sq. ft. of $1,437 (See Figure 14). The revenue per sq. ft. is almost flat from level of $1,465 per sq. ft. disclosed in its IPO prospectus in 2016.
Aritzia witnessed same store sales growth (“SSS” or comparable sales growth) of between 7% to 10% between FY2018 to FY2020. After not reporting SSS growth during FY2021 and FY2022 due to store closures, the FY2023 SSS growth came in very promising at quarterly growth in high 20s (See Figure 15). Further, Aritzia’s revenue is bucketed toward Q3 and Q4 of the financial year which together account for 60% of the annual revenue.
eCommerce revenue
Aritzia did not disclose its eCommerce revenue prior to FY2020. However, as per its IPO prospectus, its eCommerce revenue in FY2016 as $65 million. At the current eCommerce revenue of $677 million, it has grown over 10x in the last seven years at a CAGR of 40%.
Geographic breakdown of revenue
For LTM November 2022, Canada, and US both represented 50% of total revenue of Aritzia. It is important to note that US revenue was only 34% of total revenue in FY2021. Over FY2018 to LTM, the US revenue has grown at CAGR of 39% and the Canadian revenue has grown at a CAGR of 13%.
E. Historical financial performance
In this section, we discuss the 5-year historical financial performance of Aritzia.
Gross profit margins
Over FY2018 to LTM Nov 2022, Aritzia had average gross profit margins of 40%. Aritzia does not own manufacturing facilities for its products and sources them directly from manufacturers. As per the company’s IPO prospectus, it sourced goods from 50 manufacturer with the top 10 vendors contributing 51%. No single vendor contributed more than 10%. The company also does not enter long term supply contracts with vendors. It has a formalized quality assurance program where the factories of manufacturers are audited by a third-party firm to ensure compliance with local laws and global standards.
Selling, general & administrative expenses
Aritzia’s SG&A expenses increased from $184 million (25% of revenue) to $551 million (28% of revenue) for LTM November 2022. Around 80% of Aritzia’s SG&A expenses are comprised of employee costs.
Employee costs
The company’s employee costs increased from $148 million in FY2018 to $440 million for LTM November 2022, growing at CAGR of 24%, that is, slightly higher rate than growth of revenue (22%) during the same period. Aritzia employed 6,569 personnel (excluding seasonable workforce) as of February 2022. 4,410 of those staff work in Aritzia’s stores, 1,487 work in support and 672 work in the distribution centres. Aritzia also employs seasonal workers during peak season. The average salary per Aritzia employee in FY2022 was around $48,000 per year.
The number of employees per boutique has increased substantially from 24 in FY2020 to 42 in FY2022. In other words, the retail revenue per employee has decreased significantly from $329K in FY2020 to $211K in FY2022. This indicates decreasing retail employee productivity, however at a company level the margins are strong because eCommerce, which is a higher margin business, has gained share in overall revenue. It will be interesting to see how this figure trends over time.
EBITDA margin
With the exception of FY2021, Aritzia’s EBITDA margin during FY2018 to FY2022 averaged ~17%. EBITDA margin for LTM November 2022 was lower compared to FY2022 due to lower gross margins.
Capital expenditure
Between FY2018 and FY2022, Aritzia on average spent $60 million per year on capital expenditure. For LTM November 2022, Aritzia has spent $104 million in capital expenditure. Capital expenditure was relatively higher due to construction of a new 550K square feet distribution centre in Vaughan, Ontario which will replace one of the existing 150K square feet third party operated distribution centre. In FY2022, the company also acquired a 75% stake in the men’s athletic brand, “Reigning Champ”, for $33 million.
Working Capital
Aritzia’s working capital averaged at 4% of revenue between FY2018 and FY2022. The average inventory days where 80 and the average payable days where 40. Aritzia’s inventory increased significantly between February 2022 and November 2022 to 159 days. It seems to be a strategic decision by the management, since Q4 tends to the biggest sales quarter for Aritzia, and the firm did not want to sales due to low inventory. Management also noted that most of the inventory is concentrated in client favorites.
“As a reminder, we had extremely low inventory levels in the back half of last year, which negatively impacted sales. We made the strategic decision to order future season buys earlier in order to build back our inventory base, mitigate supply chain risk and ensure our ability to fuel the robust demand for our product. Due to the improved lead times, product has been arriving even earlier than anticipated, accentuating the comparison to the prior year.” - Todd Ingledew, CFO, Aritzia Q3 FY2023 Conference Call
Return on invested capital
Aritzia’s return on invested capital is in high 30s. Considering that Aritzia has 80% ROIC at the store level, this is not a surprise.
F. Management performance and governance
Key Management Compensation, tenure and alignment
You can read about the management and board of directors of Aritzia from here. The board of directors includes private equity partners (Berkshire)and former executives from well know fashion companies such as Aldo, Lululemon, Mountain Equipment Company (MEC) and SSense.
The key management (Brian Hill and Jennifer Wong) have been running the business for decades. Brian Hill, who is the founder of Aritzia, stepped down in 2022. Jennifer Wong has replaced him as the CEO and had been previously serving as the president and COO2. However, Brian Hill still remains deeply involved in the business and holds 18.7% equity interest. He recently sold a part of his equity interest for estate planning and diversification purposes.
As per SimplyWallSt, CEO’s total compensation is below average for companies of similar size in the Canadian market. Aritzia’s CEO compensation included equity-based compensation awards for a total annual compensation target of $3 million, comprised of 50% in stock options that vest over a five-year period, and 50% in performance share units with the targets tied to Aritzia long term performance. Net sales (50% weighting) and adjusted earnings before interest and taxes (50% weighting) are the performance criteria for PSUs granted in FY2022. We feel this aligns the interests of management and shareholders of Aritzia.
Employee satisfaction and culture
The company current has a Glassdoor rating of 3.6. This is not the greatest. However, employees noted that they do get good discounts on products (40%).
Financial performance of management
At the time of its IPO in 2016, Aritzia set certain financial goals, included doubling its total revenue and increasing eCommerce to 25% of total revenue. The management has surpassed all goals quite comfortably even with the challenging environment for retail business during the pandemic.
Capital Allocation
In addition to reinvesting in the business for growth, the management has been opportunistically buying back shares. Since its IPO, Aritzia has bought has 8.7 million shares for $187 million. Average cost comes to $21 per share which is less than half of the current share price of $47.3. In January 2023, the company issued another normal course issuer bid where it may purchase up to 3.9 million shares.
The company made a single acquisition of a men’s wear brand which has 4 stores. However, the transaction is very small in the overall scheme of things for now. It will be interesting to see how this transaction pans out for Aritzia.
Further as of November 2022, the company did not have any financial debt (only capitalized leases).
Conclusion on Management and Governance
Overall, regarding the management and governance of Aritzia, we conclude the following:
Management is highly experienced and has healthy ownership in Aritzia.
Management’s interests are aligned with shareholder in terms of compensation (Performance Stock Units are linked to revenue and EPS).
CEO compensation is below industry level.
Historically, management has met its 5-year financial performance goals even in a pandemic.
Management has been good at capital allocation, with consistent buybacks and reinvestment subject to one caveat on small acquisition of men’s wear brand.
Board of directors are experienced industry professionals with private equity professional helping in maintain overall balance of the board.
G. Valuation summary
Key assumptions for projections:
Revenue: We estimate that Aritzia’s revenue will grow from $2,002 million in LTM November 2022 to $3,643 million in FY2027 representing a CAGR of 16%. This will be driven by retail revenue and eCommerce growth.
Retail Revenue: In line with management guidance, we expect the firm to open 8 to 10 stores per year and reach around 150 stores by end of FY2027. Historically the management has executed on 5-6 new stores per year. Accordingly, 10 stores per year it not big execution risk. We keep Canadian stores constant with growth coming from increased penetration in the U.S.
Flued by store expansions and growth in the U.S., we expect revenue per store to rise from $11.5 million in LTM November 2022, to $14 million in FY2027.
eCommerce Revenue: We project eCommerce revenue to grow to $1,500 by FY2027. This is in line with management guidance. We can’t do a deeper analysis on this because of the lack of data points, but eCommerce has shown good historical growth.
Gross and EBITDA margin: We assume gross margins of 42% throughout the projection period. That is 200bps higher than the average gross margins of the company during FY2018 to FY2022. We believe as eCommerce’s share of total revenue and the share of U.S. in total revenue grows, the gross margins will expand. Accordingly, we expect EBITDA margins to steadily increase to 19% by terminal year.
Capex: We have considered total capital expenditure of $500 million during FY2024 to FY2027 at $125 million per year. This is in line with management projections. This will be spent on distribution centers and store expansion.
Working capital: We project that the elevated inventory levels will normalize over the next 2 years and reduce from 158 days of inventory to 75 days of inventory in FY2026.
Discount rate and Exit EBITDA multiple: We use a discount rate of 10% for all our analysis. While, it is contrary to investment theory, it helps us compare investments on an apples-to-apples basis. As much as possible, we try to factor in all company specific risks into the cash flows.
We assume an exit EBITDA multiple of 13x. This is meaningfully lower than the current LTM EBITDA multiple of 18x. However, even if the multiple goes down to 10x, the intrinsic value estimate is about $52.
A. Risks and Opportunities
Risks:
Key will be to track how Aritzia is able to maintain its brand relevance over the next 3-5 years. Social media is ever evolving and fashion trends are often fleeting. The company has shown an ability to always stay on top on fashion trends and maintain brand value.
Store employee productivity seems to be declining. Coupled with wage inflation, this can turn out to be a big concern for the company’s cost structure and can put pressure on margins.
There is intense competition in the North American Women’s apparel industry with low barriers to entry.
Opportunities
Projections do not model growth beyond North America into Europe and China which are very likely big markets for Aritzia in the future. We believe Europe and China will be key markets for Aritzia’s expansion beyond FY2027.
“We do get lots of questions on international. I heard somebody already asked a question on international. So I'm going to tell you right now that we believe in order to be a wildly successful and internationally known brand, you have to be famous in the U.S……….So it is our mission, and it is part of our plan. And remember, we have a long-term view of our business. It is in our plan right now to get famous in the U.S.” – Jennifer Wong, CEO
The company’s recent acquisition of a men’s wear brand (Reigning Champ) and launch of Super Puff jackets for men will open new opportunities in the men’s apparel category.
B. Conclusion
At the current share price of $47.3 per share, and an intrinsic value estimate of $65 per share, Aritzia presents an upside opportunity of ~36%. We are confident in the management’s ability to scale the business over the next five years. We are also cautious of risks relating to competition and maintaining brand relevance.
Q4 FY2023 Update
You can read my views on Aritzia’s Q4 FY2023 results in this Twitter thread:
https://twitter.com/FairwayResearch/status/1653601816880242690
Thank you for reading our deep dive on Aritzia. Please let me know how I could have done better by commenting below or you can reach me on Twitter @FairwayResearch.
Disclaimer: Fairway Research is currently long Aritzia shares. This report is only for educational purposes and is not meant to be investment advice. Readers should do their own due diligence before investing.
https://www.bnnbloomberg.ca/inside-the-hottest-fashion-chain-in-the-us-1.1869727
Wong joined the Aritzia in 1987 as a style advisor (the term Aritzia uses to refer to its sales associates) at the Robson street store in Vancouver, while studying economics at the University of British Columbia. She rose through the ranks from assistant store manager, to manager, to vice-president of operations. Wong was named COO in 2007, and in 2015, was named president & COO of Aritzia. Read more here.










Hi, Good research, Thank you for sharing.
Where did you see Brian Hill hold 18% stake? On Tikr and interactivebroker, I dont see this. Only Simply wall st is showing Brian Hill owns 18% stake. How to know which is correct?
Thank you for the analysis and for sharing it. It's thorough and identifies drivers of growth correctly. It's maybe also worth considering that they have some 600 million in capital leases (or 4.5 per share). These are debt equivalents I would take out of your estimate of enterprise value (leases as debt have prior rights compared to common equity). Regarding the terminal multiple, based on data I collected, over 2006 – 2022 value between 10 and 12 (10.8 to be exact) seems like a fair estimate. Still the same (https://pages.stern.nyu.edu/~adamodar/New_Home_Page/dataarchived.html) data would suggest cost of capital of 8% so those two level out in a way 🙂 Keep up the good work! 🍀