Information Services Corp (TSX: ISV) - Deep Dive
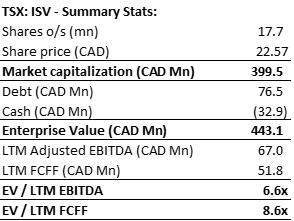
A monopoly information services business with above 30% ROIC at 6.6x EBITDA
Thank you for being a subscriber to Fairway Research.
Today we take a deep dive into Information Services Corp (TSX:ISV). If you like moats, free cash flow, high ROIC stable boring businesses, then ISC is definetly worth a read. I hope you like the report. As always, if you wish you view this report in PDF (recommended) then please click below:
If you are liking the deep dives then please share these with your friends and colleagues. Let’s dig in.
A. Executive Summary
ISC is a former crown corporation that provides registry and information management services and has an exclusive contract with the government of Saskatchewan for handling registries up to 2033. The Government’s 30% equity interest ensures high chances of contract renewal beyond 2033.
The Registries business has acted as the cash flow engine of ISC helping it spend over $200 million on eight acquisitions of businesses in related verticals, diversifying revenue and EBITDA profiles.
During the last 5 years, ISC has more than doubled its revenue from $93.6 million in 2017 to $188 million during the last twelve months. At the same time, EBITDA has also more than doubled from $32 million to $67 million.
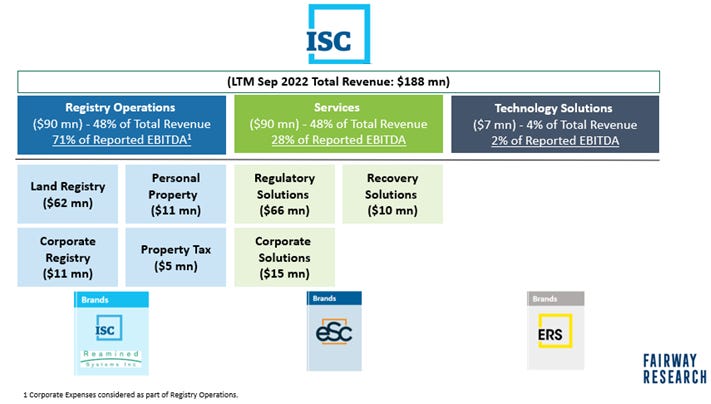
ISC divides its business into 3 main segments, Registry Operations, Services, and Technology Solutions. Registry Operations and Services both contributed 48% each to the total revenue of ISC. The Technology Solutions segment contributed only 4% to ISC’s total revenue. Around 70% of ISC’s EBITDA is still driven by the Registries Operation segment.
The management of ISC is highly experienced, has a good M&A track record, has shown commendable cost management while integrating acquisitions, and is aligned with shareholders in terms of compensation plans.
ISC’s business has several attractive characteristics such as:
Registries business is an effective monopoly in Saskatchewan
Minimal reinvestment is required in terms of maintenance capital expenditures
Negative working capital since the IPO
New acquisitions are financed through internal cash or conservative use of debt.
Because of these characteristics, ISC’s business consistently generates returns on invested capital of over 30%.
ISC’s stock currently trades at 6.6x LTM EBITDA, which is the lowest multiple levels it has traded at since its IPO in 2013. Using conservative cash flow assumptions, a 10% discount rate, and a 2% long-term growth rate, my discounted cash flow indicates that ISC’s intrinsic value per share is close to $29 per share. This represents a 30% upside from the current share price of $22.57.
In this report, we take a deep dive into ISC’s history, business segments, acquisitions, historical performance, management’s capital allocation, and valuation.
My other deep dives are available on Fairwayresearch.substack.com.
B. Introduction
Headquartered in Regina, Saskatchewan, ISC provides registry and information management services for public data and records. Most importantly ISC has a 20-year master services agreement (“MSA”) with the government of Saskatchewan for handling land, personal property, and corporate registry for the province. For the last twelve months ended September 30, 2022 (“LTM”), ISC had revenue of $188 million. ISC had 400 employees as of the end of 2021. ISC trades on the Toronto Stock Exchange under the ticker “ISV” and has a market capitalization of $400 million.
Figures in the report are in Canadian dollars unless otherwise noted.
C. Business History
1. Pre-IPO (2000 to 2013)
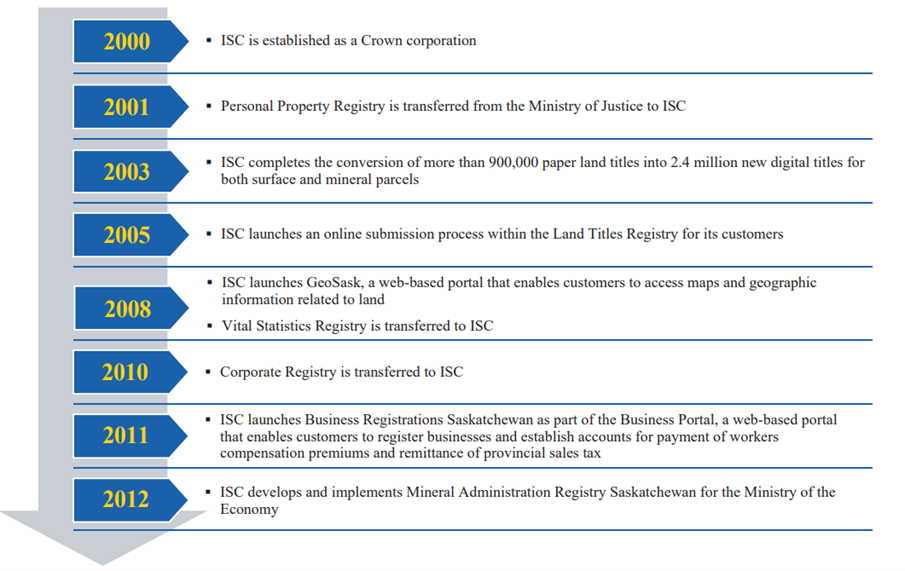
Information Services Corporation (“ISC”) was first created as a Saskatchewan Provincial Crown Corporation on January 1, 2000. The company was responsible for the administration of the Land Registry system as well as the Land Survey for various provincial departments. Additionally, in 2001 ISC also became responsible for the personal property registry in Saskatchewan and in 2010 it also took over the corporate registry function. In May 2013, right before its IPO, ISC transitioned to being a private corporation and signed a 20-year MSA with the Saskatchewan government for the provision of registry services.
Figure 1: ISC Business History (PRE-IPO)
2. Post-IPO (2013 to 2023)
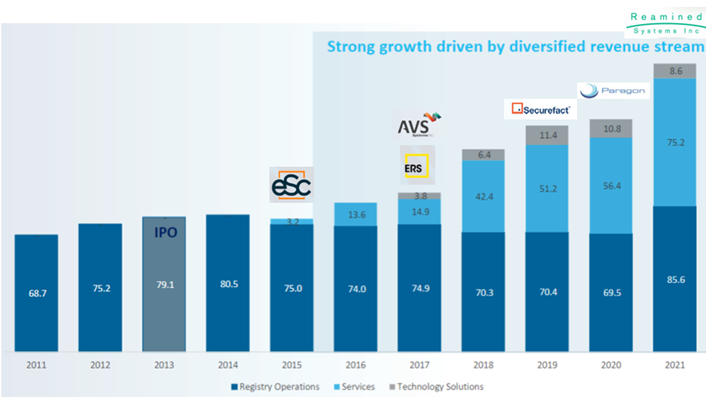
Between 2013 and early 2023, ISC diversified its business away from Saskatchewan registries. At the time of its IPO, ISC’s entire $80 million revenue consisted of Saskatchewan registries and by 2021 registries only represented 51% of ISC’s total revenue. ISC achieved this by acquiring nine companies within two new business segments, i.e., Services and Technology Solutions. However, ISC is still quite dependent on the Registry Operations segment when it comes to EBITDA. For the last twelve months (“LTM”) ended September 30, 2022, the Registry Operations segment contributed more than 70% of the reported EBITDA of ISC (that is even after loading the corporate expenses entirely to the Registry Operations segment). I discuss this in more detail in the next section.
Figure 2: ISC Revenue Evolution
Logos in Figure 2 represent acquisitions.
D. Stock Performance
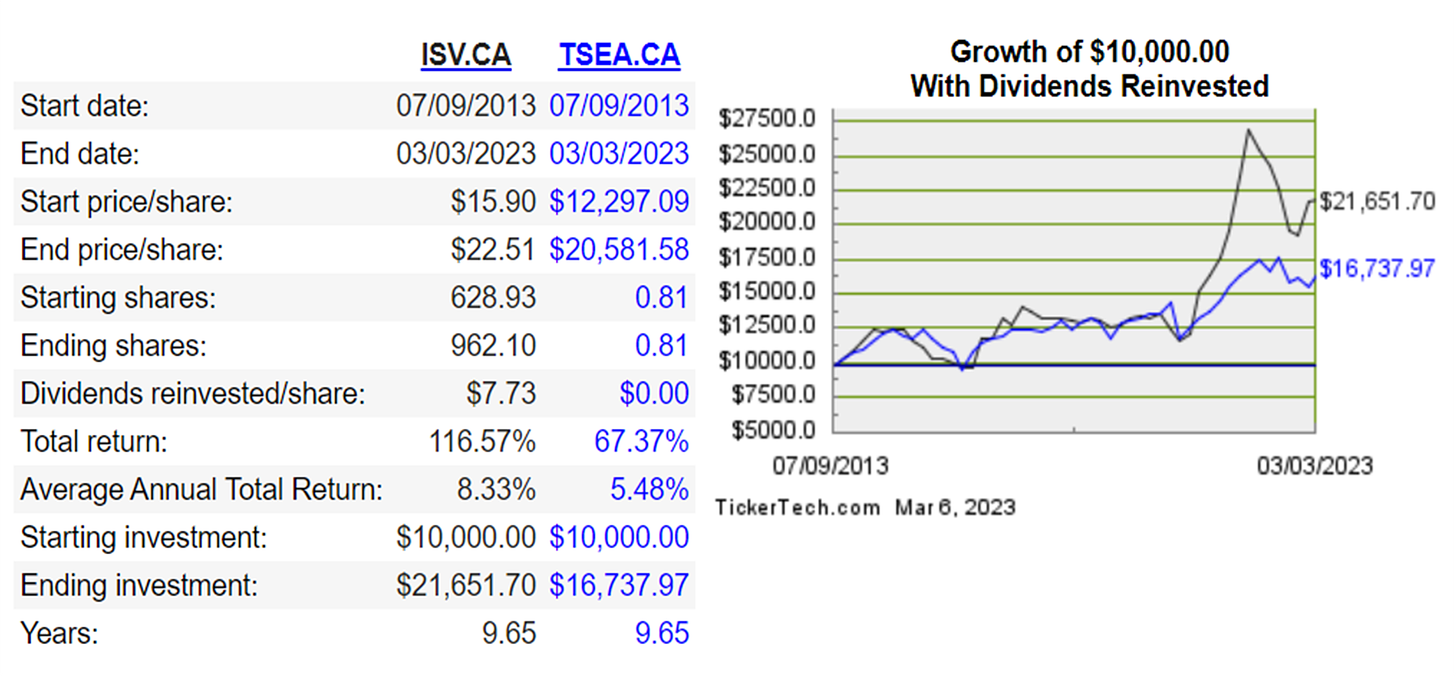
Figure 3: ISC Stock Return since IPO
Since its IPO in 2013, $10,000 invested in ISC has turned into $21,652 at an annual return of 8.33%. During the same period, $10,000 invested in the TSX Composite Index turned to $16,738 at an annual return of 5.48%.
E. Understanding ISC’s Business and Acquisitions
NOTE TO READER: In this section, I discuss the various business segments of ISC and the major acquisitions over the last 8 years within each segment. While, in my other deep-dive reports, acquisitions have had a dedicated section, with ISC I felt it is best to introduce the acquisitions when the reader is trying to understand the business segments. The reason for this is that the ISC’s acquisitions themselves are creating new Segments and Sub-segments.
For each of the major acquisitions I analyze the business of the target company, management’s rationale of the transaction, acquisition pricing, financing, post-acquisition performance of the target within ISC, and my overall remarks.
ISC divides its business into 3 main segments, Registry Operations, Services, and Technology Solutions. Registry Operations and Services both contributed 48% each to the total revenue of ISC. The Technology Solutions segment contributed only 4% to ISC’s total revenue. The Registry Operations segment is the legacy Saskatchewan registry business of ISC. The Services and Technology Solutions segments have been built through acquisitions. In this section, we will dive into the products and services, historical performance, and relevant acquisitions for each of the segments.
Figure 4: ISC Business Breakdown
1. Registry Operations Segment – The Crown Jewel of ISC
The Registries Operations segment is the legacy business, the cash cow, and the crown jewel of ISC. It operates registries and related services on behalf of two provincial governments in Canada (Saskatchewan and Ontario). Through this segment, ISC provides registry and information services on behalf of the Province of Saskatchewan under a 20-year MSA, in effect until 2033, and is the exclusive provider of the Saskatchewan Land Registry, the Saskatchewan Personal Property Registry, the Saskatchewan Corporate Registry.
In June 2022, ISC entered Ontario property tax services through the acquisition of Reamined which has an exclusive agreement with the Province of Ontario to provide property tax infrastructure and services to over 440 municipalities in Ontario, facilitating the management of property tax rates and distribution.
There are no competitors to ISC in Saskatchewan, but Teranet, an OMERS portfolio company manages registries for Ontario and Manitoba. Only three provinces have fully privatized the operation of their land registries. Manitoba and Ontario pursued privatization through partnerships with Teranet. The company began in 1990 as a public-private partnership created by the Ontario government. Since 2008, Teranet has been wholly owned by the Ontario Municipal Employees Retirement System (OMERS). In 2014, Teranet entered a full-concession exclusive license to operate the land registry in Manitoba. Saskatchewan’s land registry is operated by the ISC which began as a Crown corporation but became a publicly listed company in 2013. British Columbia has adopted somewhat of a hybrid, semi-privatized model whereby the land title and survey authority operates as a statutory corporation.
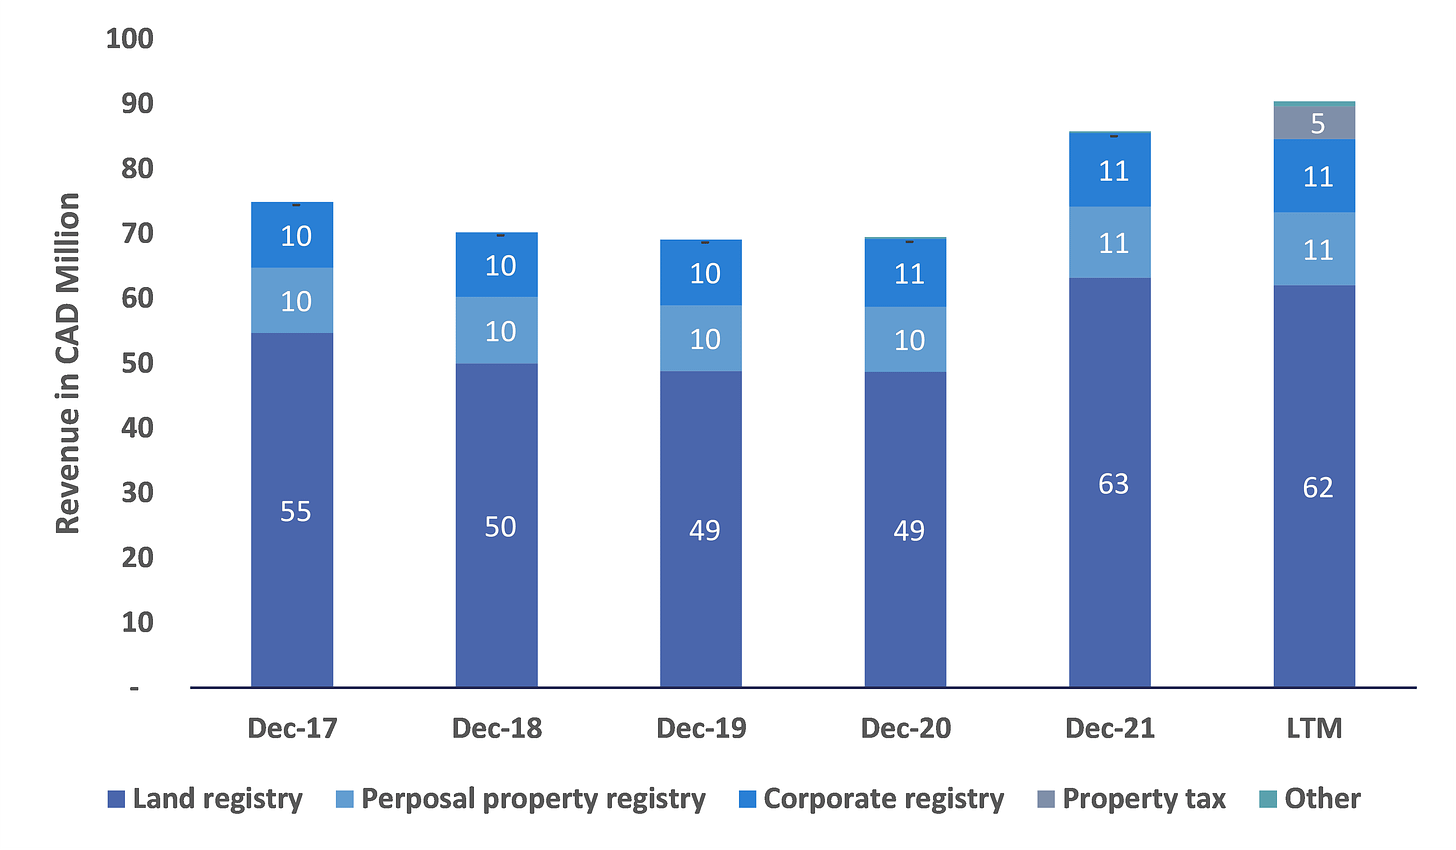
Overall, the Registry Operations segment is a low or flat-growth business with high margins. As the majority of the revenue of Registry Operations comes from the land registry sub-segment (See Figure 5), the real estate activity in Saskatchewan is a major driver of revenue. The services in this segment are provided under ISC and Reamined brand names.
Figure 5: Registry Operations Revenue by Sub-Segment
I will now discuss each of the above sub-segments within Registry Operations in detail.
i. Land titles registry (70% of Registry Operations revenue)
The Land Titles Registry issues titles to land and registers transactions affecting titles, including changes of ownership and the registration of interests in land, in Saskatchewan. The Land Titles Registry provides land ownership information to support new and used home sales, land and home development transfers, and other value-added transactions. Its primary users include law firms, financial institutions, developers, and resource companies. Revenue for the Land Titles Registry is earned through registration, search, and maintenance fees (registration is more than 80%). Registration fees are either a flat fee or value-based, calculated as a percentage of the value of the land and/or property being registered (0.3% as per MSA). ISC typically charges a flat fee per transaction for search and maintenance transactions. As per the MSA, the fees increase each year as per Saskatchewan CPI figures (June to June period). 60% to 70% of land registry revenue is ad valorem (0.3% of value). Nearly 86 percent of all Land Titles Registry registration transactions were submitted online in 2021.
Figure 6: Land Title Registry Revenue
The revenue from the land title registry was flat between 2018 and 2020 at around ~$50 million. However, with the increase in real estate activity in 2021, revenue increased to $63 million in 2021. As real estate activity in the country slows down, the revenue from the land registry sub-segment will likely decrease to pre-pandemic levels. ISC’s average revenue per transaction in the land registry segment was $74. You can read more about the fees charged by ISC for various transactions here.
ii. Personal property registry (12% of Registry Operations revenue)
The Personal Property Registry enables lenders as well as buyers of personal property, such as motor vehicles, to search for information such as security interests registered against an individual, business, or personal property used as collateral. General provincial economic drivers, including automotive sales, interest rates, and the strength of commercial activity in Saskatchewan, influence the revenue in the Personal Property Registry.
Customers for personal property registry include third-party providers to the financial industry, financial institutions, insurance companies, law firms, equipment and auto dealers, and auctioneers. Customers are charged flat fees per transaction and almost all searches are completed online.
Figure 7: Personal Property Revenue
During the last 5 years, revenue from personal property registry has largely been flat at around $10 to $11 million. This is due to variations in personal property transactions. At the same time, the average revenue per transaction has increased from $215 in 2017 to $246 in 2021. Going forward the revenue from personal property should be relatively flat.
iii. Corporate registry (13% of Registry Operations revenue)
The Saskatchewan Corporate Registry is a system for registering business corporations, non-profit corporations, co-operatives, sole proprietorships, partnerships, and business names. Every corporation must be registered in the Corporate Registry to maintain its legal status and carry on business within Saskatchewan.
ISC’s corporate registry customers include law firms, companies in the financial sector, accountants, and businesses such as non-profit and cooperative associations. Services are billed as flat fees for each transaction. ISC earns most of its fees in the Corporate Registry in relation to maintenance services provided to business entities that file annual returns or wish to make changes to their structure or profile. Almost all the transactions were completed online.
Figure 8: Corporate Registry Revenue
Similar to revenue from the personal property sub-segment, the corporate registry revenue during the last five years has been flat between $10 to $11 million. The average revenue per transaction is $31.
iv. Property tax (6% of Registry Operations revenue)
On June 1, 2022, ISC completed the acquisition of Reamined which has an exclusive contract with the Province of Ontario to provide property tax management infrastructure and services.
Reamined has provided these services to the Province of Ontario for over 25 years and typically renewed up to five‐year agreements with the province. These services support critical applications of information used by municipalities to facilitate the determination of property taxes annually. The total revenue for each year of the agreement is determined at the time of renewal and is paid monthly by the Province of Ontario to Reamined.
Below we take a deeper look at the Reamined acquisition, the only acquisition done by ISC within the Registry Operations segment to date.
v. Reamined Acquisition (2022)
Business Description
ISC completed the acquisition of Reamined on June 1, 2022. The acquisition led to the formation of the new Property Tax sub-segment under the Registry Operations Segment. As mentioned above, Reamined which has an exclusive contract with the Province of Ontario to provide property tax management infrastructure and services. The contract pricing increases as per CPI over the life of the contract.
Management’s Strategic Rationale on the Paragon acquisition
Acquisition pricing and financing
ISC has not disclosed the financials of Reamined. However, for the period June to September 2022, Reamined had revenue of $5 million. Accordingly, the extrapolated full-year revenue of Reamined is likely $15 million. ISC’s management has stated that Reamined’s margin profile is similar to the Registry Operations segment. Accordingly, assuming a 50% EBITDA margin, Reamined is expected to have an EBITDA of $7.5 million and an EV / EBITDA multiple of 6x for the acquisition.
Post acquisition performance
The sub-segment will likely only grow marginally based on CPI increases. Revenue is fixed under contract.
Fairway Research Remarks on Reamined
ISC has acquired a stable business that is related to its existing Registry Operations business. Even though Reamined is a slow-growth business, it will further boost the already strong cash flow profile of the Registry Operation segment due to high margins.
vi. Registry Operations Segment Financial Performance
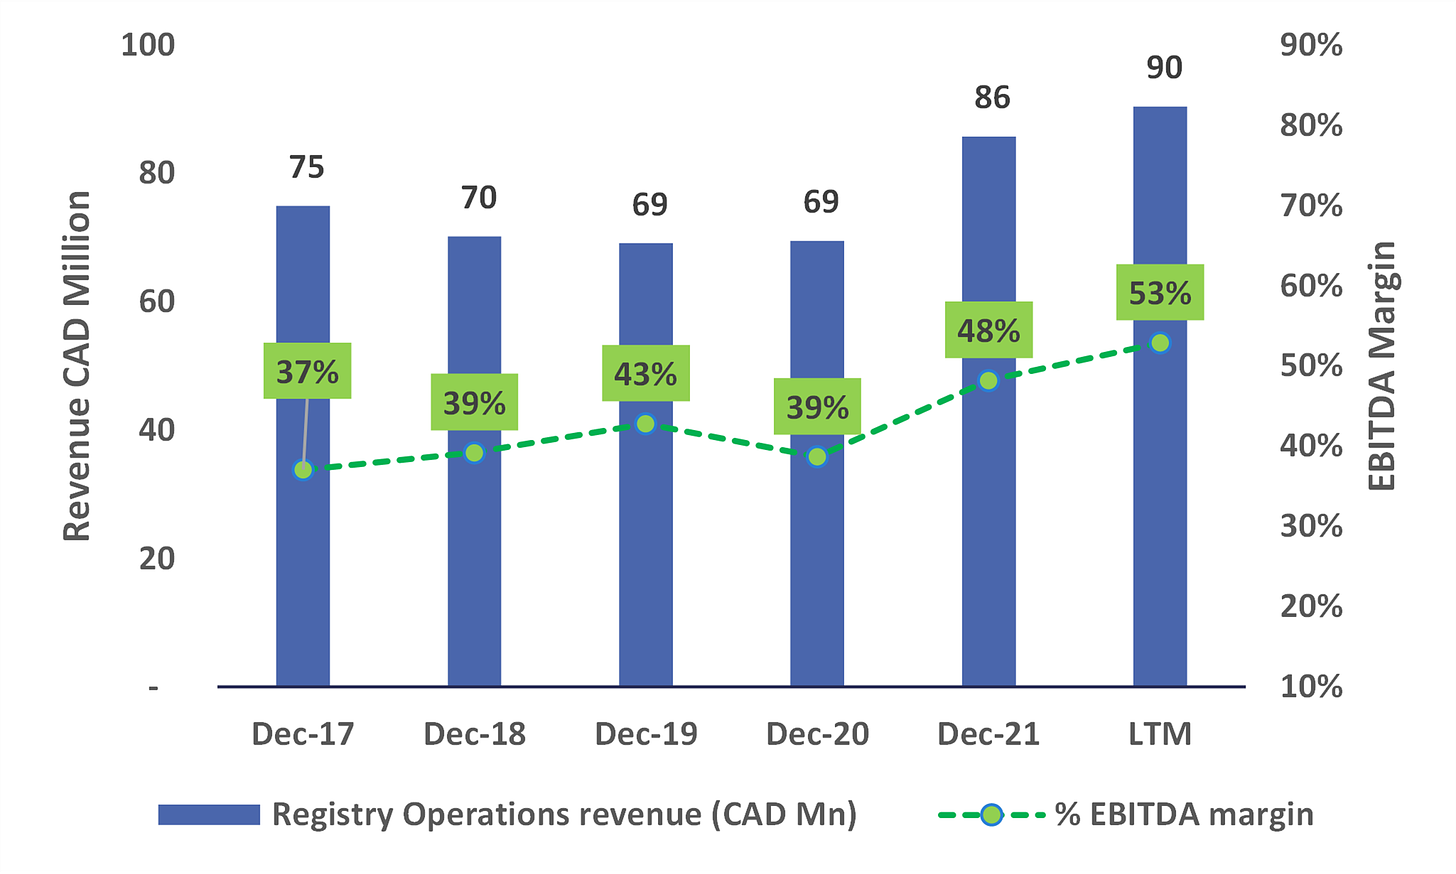
The Registry Operations segment is a high-margin low growth business. As discussed above, revenue largely depends on how the Saskatchewan economy does with real estate activity and car sales being the main drivers. The corporate registry business is more maintenance in nature. Between 2018 and 2020, revenue largely stayed flat at around $70 million.
Figure 9: Registry Operations Financial Performance (Including Corporate)
Figure 10: Registry Operations Segment Return on Assets (Including Corporate, before tax)
The Registry Operations segment is the cash flow engine of ISC. Given the low amount of assets required to run the business and high EBITDA margins, the segment also boosts of very attractive return on assets (EBITDA / Total Assets) of above 30%. ISC management has indicated that as real estate activity slows down, it expects Registry Operations EBITDA to trend toward pre-pandemic levels.
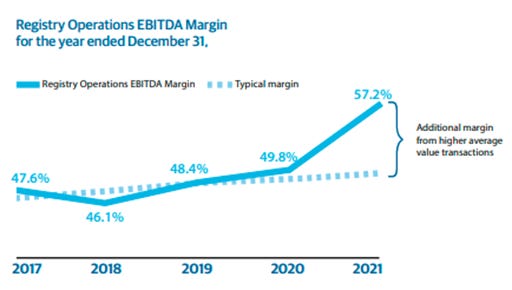
Note that I have loaded the entirety of corporate expenses, and corporate assets onto the Registry Operations segment, and still the segment have very impressive EBITDA margins and return on total assets ratio.
Figure 11: Typical Margin of Registry Operations (Excluding Corporate Expenses)
Note that excluding the Reamined acquisition, the segment has needed minimal capital expenditures. ISC overall has negative working capital.
2. Services Segment – Built through Acquisitions
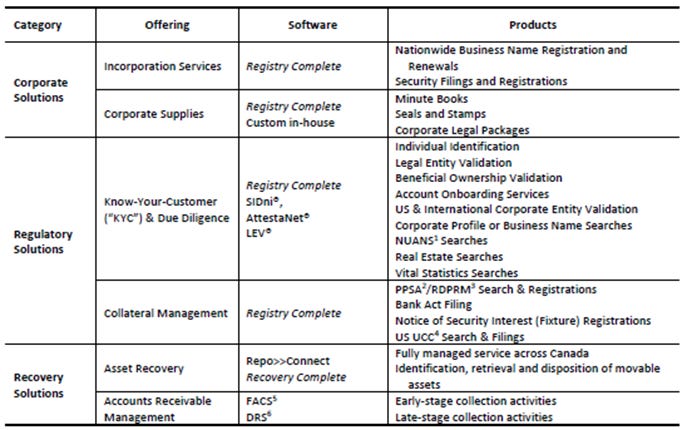
Services Segment provides solutions to support registration, due diligence, and lending practices of customers across Canada. ISC’s Service Segment offerings are generally categorized into three divisions, namely Corporate Solutions, Regulatory Solutions, and Recovery Solutions. The Corporate and Regulatory solutions sub-segments were built up through two main acquisitions, ESC Corporate Services in 2015, and AVS Systems in 2017. The Recovery Solutions sub-segment was set up with the acquisition of Paragon in 2022. The table below sets out the various offerings provided by ISC’s Services segment. The main brand under which these services are provided is ‘ESC’.
Figure 12: Service Segment Offerings
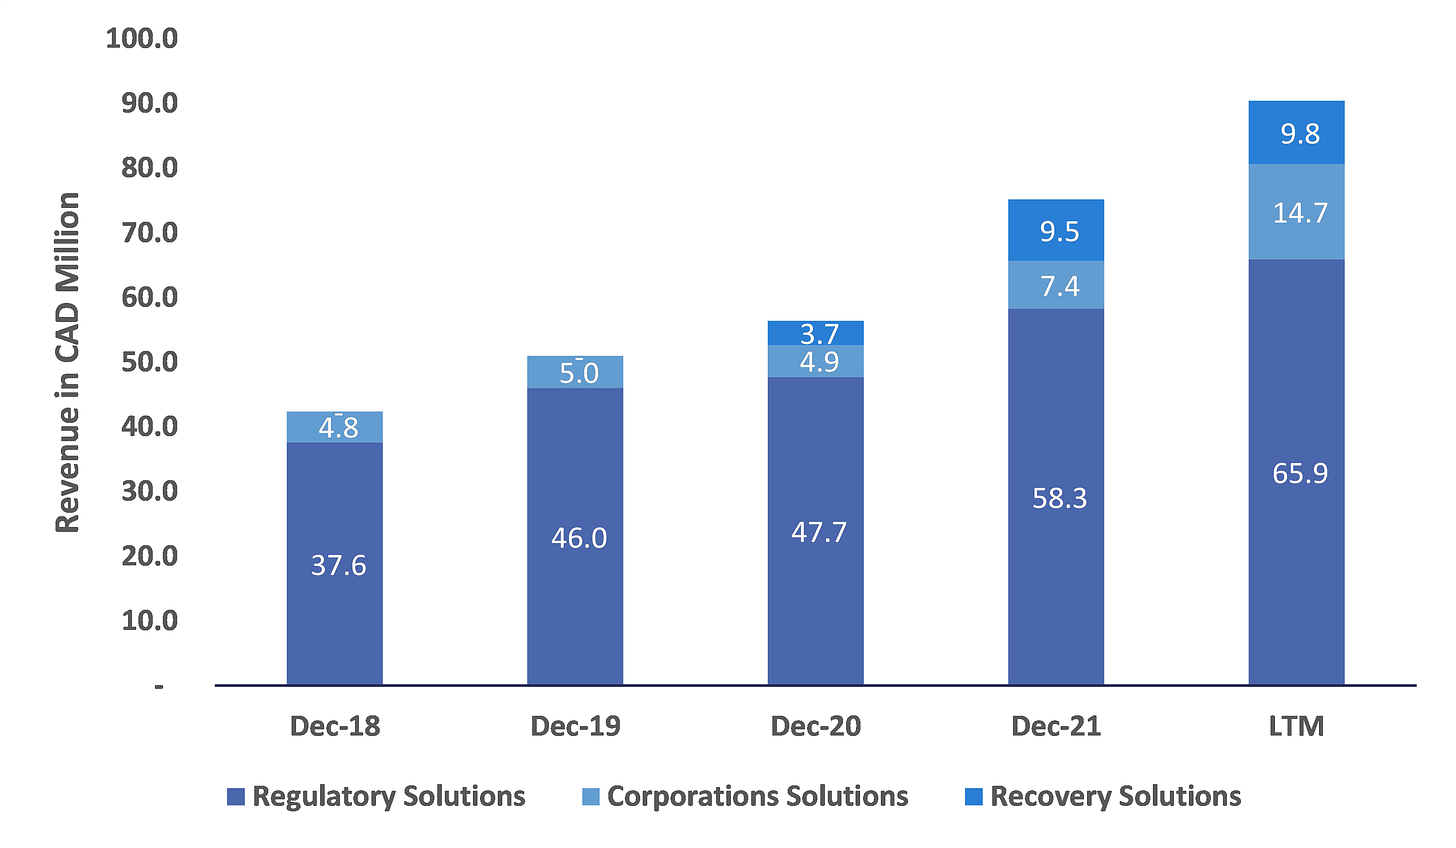
Figure 13: Services Segment Revenue Breakdown
ISC has completed six acquisitions in the Services segment between 2015 and 2022, including ESC Corporation Services, AVS Systems, SecureFact Transaction Services, Paragon, and Uplevel. Figure 14 below includes a summary of all transactions completed in the Services Segment. We will now dive into the three main transactions in the Services segment, i.e., ESC Corporate Services, AVS Systems, and Paragon. Together these three transactions represented around 90% of the acquisition spending within the Services Segment.
Figure 14: Services Segment Acquisitions
i. ESC Corporate Services Acquisition (2015)
Business description
ISC first entered the services segment through the acquisition of ESC in 2015. This was ISC’s first venture into a vertical other than the legacy Registry Operations business. ESC provides law firms, corporations, financial services institutions, and others with services and online solutions to fulfill their clients' public records due diligence, filings, and corporate supply requirements in connection with public business registries in Canada and certain other countries. At the time of acquisition, ESC had over 4,500 clients, including law firms, corporations, and financial institutions. However, the top 20 customers contributed almost half the revenue of ESC. ESC Corporate Services Ltd. was formerly known as Corporate Search, Registration and Corporate Supplies division of Dye & Durham (TSX: DND).
The main revenue sources within ESC were search and registration (largest), know-you-customer (KYC), and corporate supplies.
The small acquisition of Alliance Online for $1 million in 2017 was a tuck-in acquisition for the ESC business. Alliance was a personal property corporate and land registry searches and submission provider.
Management’s Strategic Rationale on ESC acquisition
Acquisition pricing and financing
ESC was acquired for an enterprise value of $26.7 million. The acquisition was financed with $15 million of debt and included up to $7 million worth of contingent consideration (fair value $6 million). ESC had an EBITDA of $3.2 million in 2015 implying an EV / EBITDA multiple of 8.4x. At the time of the acquisition, ISC’s own traded EV/ EBITDA multiple was ~8.6x.
Post acquisition performance
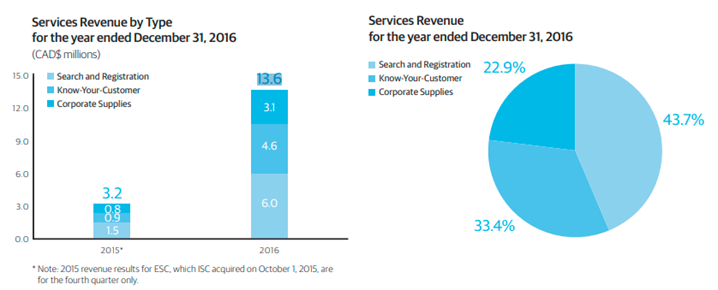
In 2016, the first full year of ESC post-acquisition, it had revenue of $13.6 million (up 10% from 2015) and EBITDA of $2.7 million (down 15% from 2015). In 2017, the Services Segment achieved revenue of $14.9 million (up 10% from 2016) and EBITDA further decreased to $1.7 million.
Figure 15: Services Segment (essentially ESC) performance in 2016
Fairway Research Remarks on ESC Acquisition
Pros
The ESC acquisition was in a vertical with a similar client base as the existing Corporate Registries sub-segment of ISC. ESC did have lower EBITDA margins of 26% as compared to the ~40% EBITDA margin for ISS before the acquisition. The acquisition EV/ EBITDA multiple was in line with ISC own traded multiple. The transaction was financed through the use of debt; albeit the amount seemed conservative. The use of contingent consideration as a risk mitigation strategy was also a good M&A tactic.
Cons
The main downside seems to have been the disappointing EBITDA performance of ESC post-acquisition. It also seems the business had minimal synergies with ISC’s current business due to no geographic overlap.
ii. AVS Systems Acquisition (2017)
Business Description
AVS Systems was ISC’s second major acquisition in the Services Segment completed at the end of 2017. AVS provided automation software technology services to serve lending, leasing, and credit issuing businesses and institutions in Canada.
Management’s Strategic Rationale for AVS acquisition
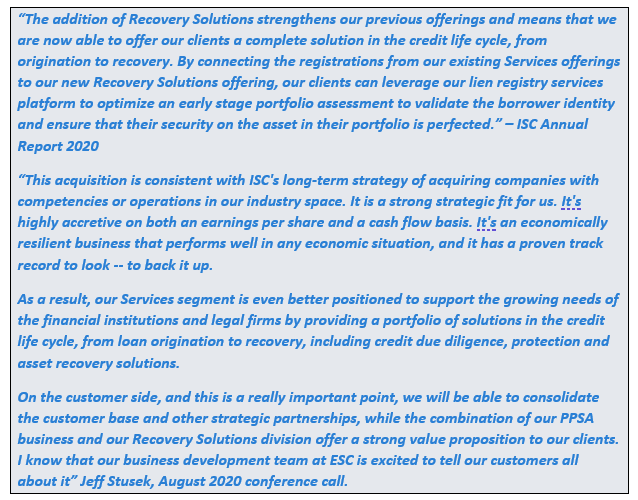
Jeff Stusek, the former CEO of ISC, mentioned on a podcast episode that ISC’s bank customers requested them to be involved at the end of the credit cycle which eventually led to the acquisition of Paragon.
Acquisition pricing and financing
CAD$25 million was paid in cash on closing and ISC agreed to a max CAD$20 million in additional consideration contingent on the realization of future business with financial institutions and auto and equipment finance companies across Canada (fair valued at $15 million at the time of acquisition and eventually paid $11 million, making the enterprise value $35 million). The acquisition seems to have been financed entirely through internal cash.
Based on financials for the 9 months ended September 30, 2017, AVS Systems was estimated to have revenue of $22.6 million and EBITDA of $2.9 million. Accordingly, the acquisition EV/ EBITDA was 12.4x. Note that AVS Systems was growing at a high rate and had almost doubled its revenue between 2015 and 2016 and was expecting to keep growing at a high rate which might have also been the reason for the high contingent consideration. ISC’s own trading EV / EBITDA was ~10x at the time of the acquisition.
Post acquisition performance
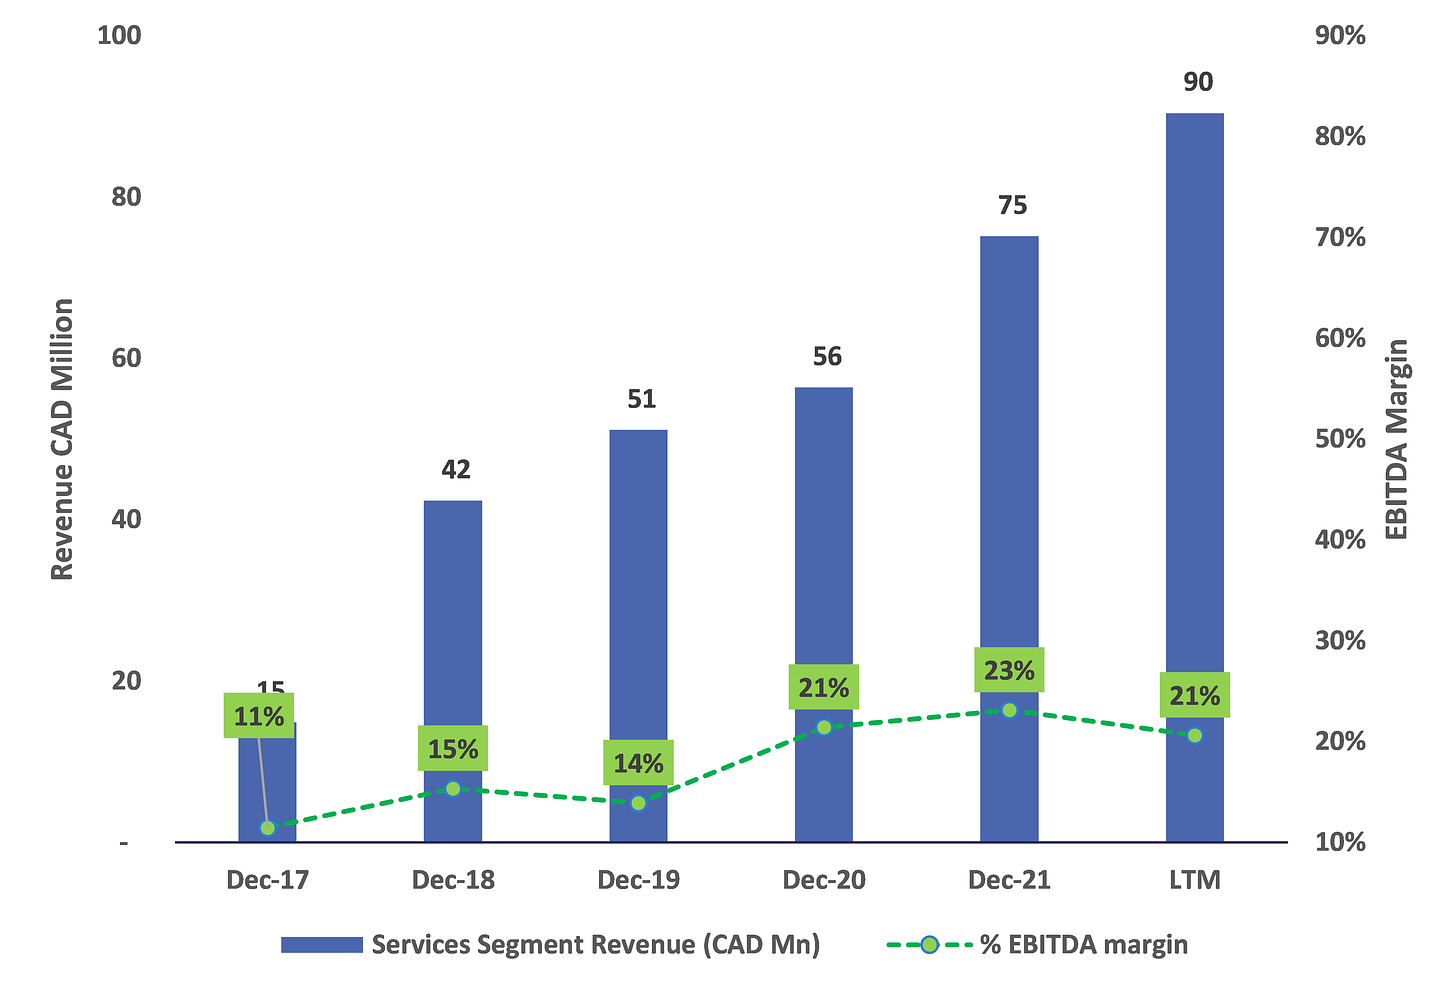
Post-acquisition AVS became part of the Segment Services along with ESC and Alliance. AVS is estimated to have contributed revenue of $26.4 million to 2018 Service Segment revenue (17% revenue growth for AVS). The Services Segment overall had a 2018 revenue of $42 million and an EBITDA of $6.5 million. Representing an EBITDA margin of 15%, a reasonable improvement from the 11% margin witnessed in 2017.
Considering ISC paid $67 million for ESC (incl Alliance) and AVS together, $6.5 million EBITDA represents a post-acquisition EV / EBITDA multiple of 10.3x.
Fairway Research Remarks on AVS Systems Acquisition
Pros
The AVS Systems acquisition was in a vertical with a similar client base as the existing Personal Property Registries sub-segment of ISC.
The acquisition EV/ EBITDA multiple seemed high at the time of the acquisition at 12.4x. However, the 2018 performance of the Services Segment seemed to imply a lower EV / EBITDA multiple of 10.3x which was reasonable.
Cons
AVS was higher revenue low margin business and had an impact on ISC’s overall EBITDA profile.
iii. Paragon Acquisition (2020)
Business Description
On July 31, 2020, ISC completed the acquisition of Paragon which provides asset recovery services. This acquisition also led to the formation of a new sub-segment within the Services Segment named ‘Recovery Solutions’. Asset recovery involves the identification, retrieval, and disposal of movable assets such as automobiles, boats, aircraft, and other forms of portable physical assets used as collateral security for primarily consumer-focused credit transactions. Customers include most of the major banks that are involved in lending in the movable asset market in Canada. The business is counter-cyclical and can pick up if interest rates keep on rising.
Management’s Strategic Rationale on the Paragon acquisition
Acquisition pricing and financing
ISC acquired Paragon for $70 million making it the largest acquisition for ISC till date. The transaction was financed primarily through $60 million of debt. For the year ended March 2020, Paragon had revenue of $12.9 million and EBITDA of $7.7 million. The transaction EV / EBITDA was 9.1x. At the time of the transaction, ISC's own trading EV / EBITDA multiple was 9.9x.
Post acquisition performance
In 2021, the first full year post the Paragon acquisition, the recovery solutions revenue was $9.5 million, which was lower than the $12 million pre-acquisition revenue. Management primarily attributed this to Covid related government support. For the LTM period, Recovery Solutions’ revenue remained flat at $9.8 million.
Fairway Research Remarks on Paragon
Pros
High EBITDA margin (60%) business. In a way, the Paragon business is a natural hedge to the land registry business of ISC which may face challenges is the economy slows down. Customers of Paragon are big banks, which already dealt with ISC through the Services Segment.
Cons
The business is also yet to reach the revenue levels that it witnessed prior to the pandemic.
iv. Services Segment Financial Performance
As discussed earlier, the Services Segment has grown through acquisitions. The Services Segments had an EBITDA margin of 23% in 2021 and 21% in the LTM period. This was less than half the EBITDA margin enjoyed by the Registry Operations Segment even with corporate expenses fully loaded onto the Registry Operations segment. If we allocate a portion of corporate expenses to the Service Segment, the EBITDA margins will be lower.
Figure 16: Services Segment Performance
Figure 17: Services Segment Return on Assets (before tax)
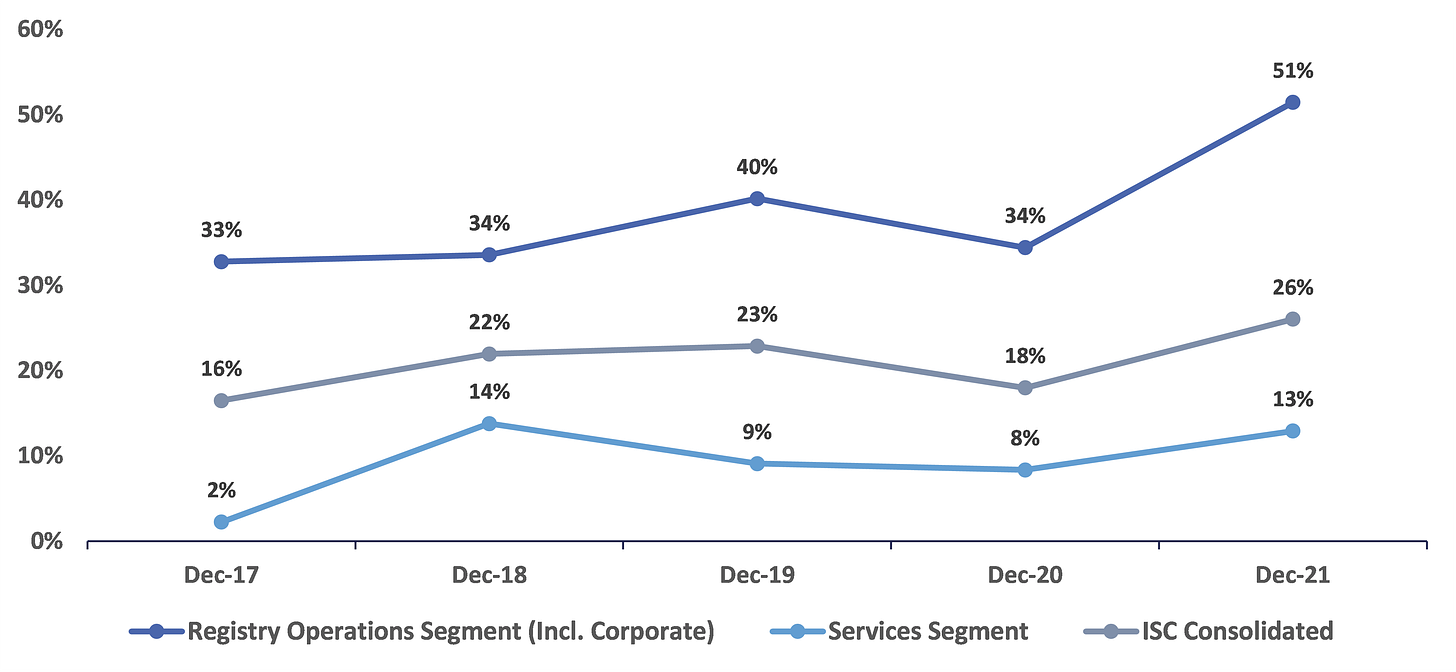
Figure 18: Registry Operations Segment Vs Services Segment Vs. Consolidated Return on Assets (before tax)
As can be clearly seen from Figure 18, the businesses being acquired within the Services Segment are clearly not as superior in terms of returns on assets as the Registry Operations segment. The Registry Operations business, even though low growth, is a monopoly business with an exclusive MSA with the provincial government. A comparable competitive advantage is difficult to replicate in acquired businesses. The Registry Operations segment is really the cash flow engine enabling the expansion of ISC into other businesses.
3. Technology Solutions Segment (ERS Acquisition, 2017)
The technology solutions segment was formed with the acquisition of Enterprise Registry Solutions in 2017. It is the smallest segment in ISC that contributes about 4% of total revenue ($7.4 million). The Segment makes revenue through:
· Sale of software licenses related to the technology platform;
· Provision of technology solution definition and implementation services;
· Provision of monthly hosting, support, and maintenance services.
These services are provided under the ‘ERS’ brand. The Segment has a software offering called RegSys that provides a readily transferable technology platform capable of registry needs. The Segment provides services to both internal clients, and external parties (mainly government clients). 52% of its revenue came from internal parties and 48% from external parties. The internal use of ERS was one of the rationales for the acquisition, as previously ISC was ERS’s customer.
“Saskatchewan Corporate Registry is built on the RegSys platform. And now that we have that technology and that expertise in-house, we're also looking at how that will apply across some of our other registries” – August 2017, Conference Call
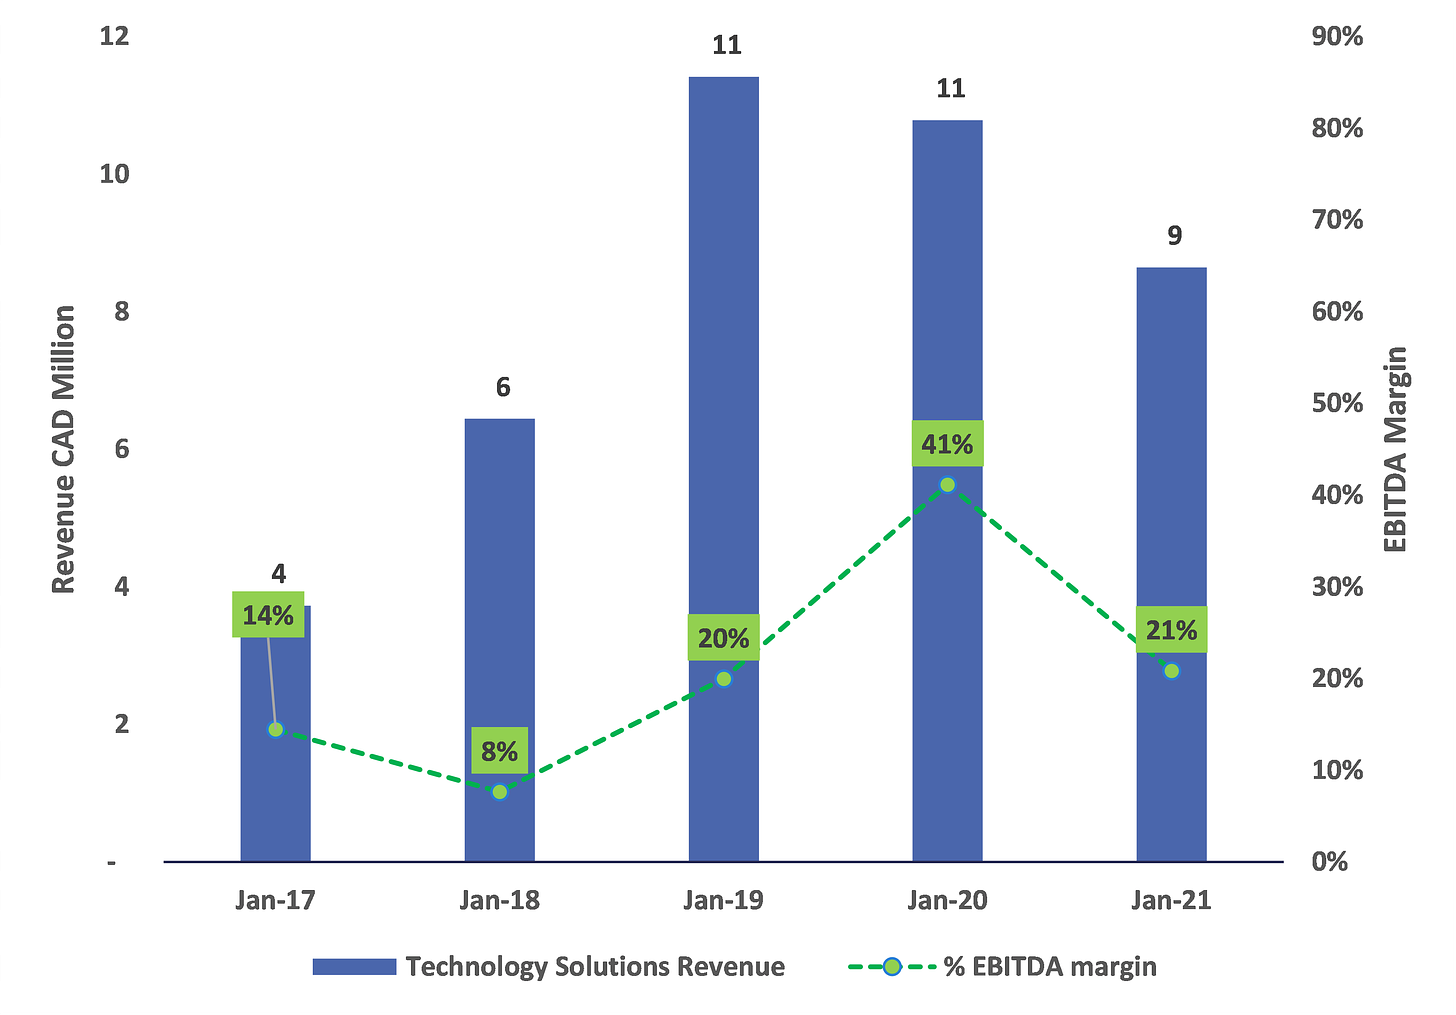
Technology Solutions’ overall performance has been sub-par with revenue declining in 2020 and 2021. The management has attributed this to Covid-related slow-down project spending while governments were prioritizing healthcare spending.
Figure 19: Technology Solutions Financial Performance
The ERS acquisition was completed in 2017 at an enterprise value of $13.4 million. Financed through internal cash, the acquisition contributed EBITDA of 0.5 million to ISC’s 2017 financials. Accordingly, the transaction was completed at an EBITDA multiple of 25x. A significant premium as compared to other acquisitions completed by ISC. However, since almost half the revenue of Technology Solutions comes from other Segments with ISC, it likely internalized some of the EBITDA which was contributed by ISC as a customer.
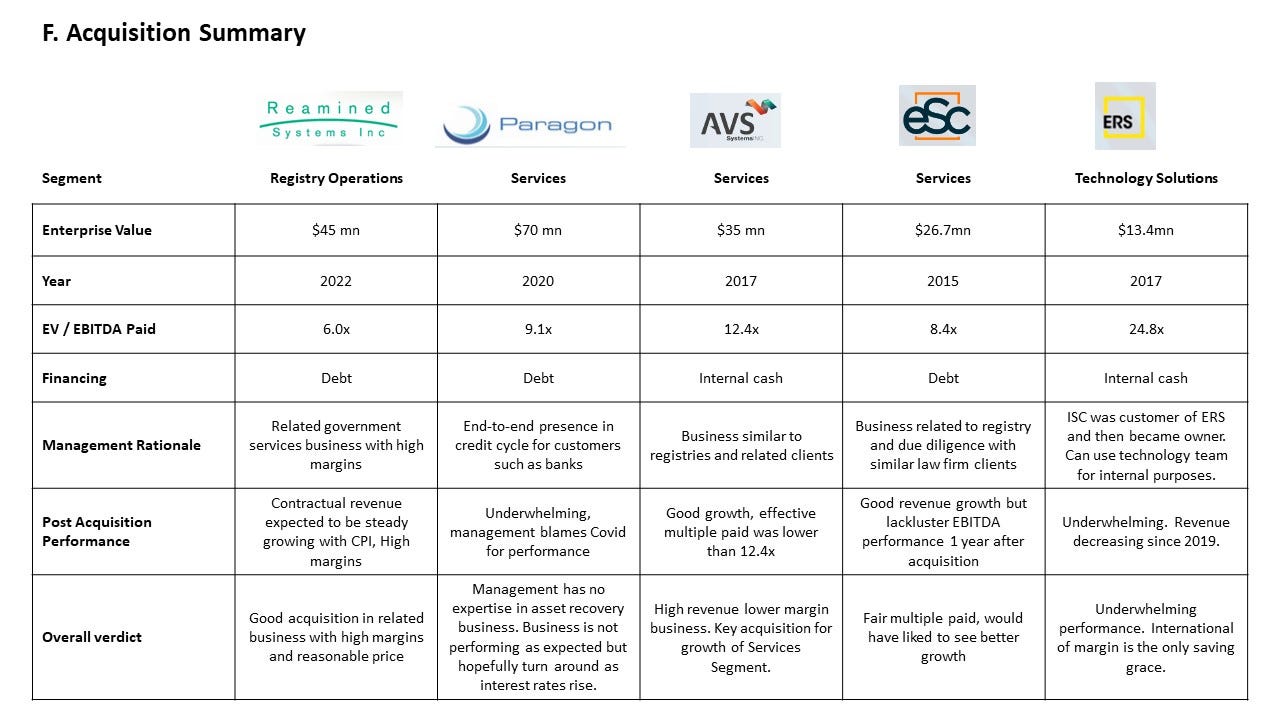
F. Acquisition Summary
G. ISC’s Historical Financial Performance
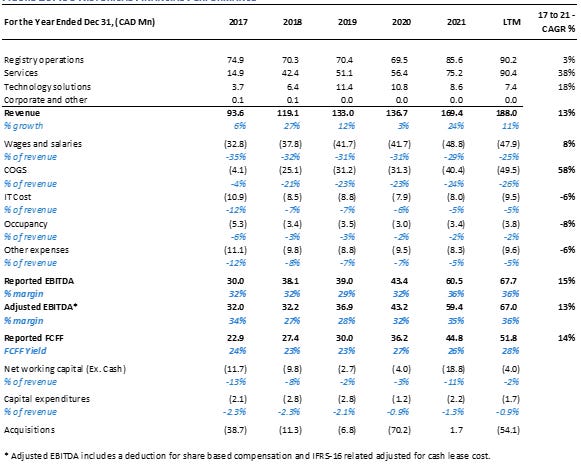
Figure 20: ISC Historical Financial Performance
1. Revenue growth
We have discussed the various drivers of segment revenue growth in Section C. Here we will discuss ISC’s consolidated revenue growth over the last 5 years. Between 2017 and 2021, ISC’s overall revenue grew at a CAGR of 13%.
ISC’s legacy Registry Operations segment only grew at a CAGR of 3%, from $74.9 million in 2017 to $85.6 million in 2021.
The Service Segment revenue grew at a CAGR of 38%, from $14.9 million in 2017 to $75.2 million in 2021. This has led to it becoming almost as big as the Registry Operations segment in terms of revenue contribution. In fact, during the LTM period, both Registry Operations and Services Segment contributed 48% each to the total revenue of ISC.
Technology Solutions is the smallest segment in ISC and grew from $3.7 million in 2017 to $8.6 million in 2021 at a CAGR of 18%.
For more details on the growth of individual segments refer to Section D.
Figure 21: ISC Revenue Composition
2. Operating Expenses
i. Wages and Salaries
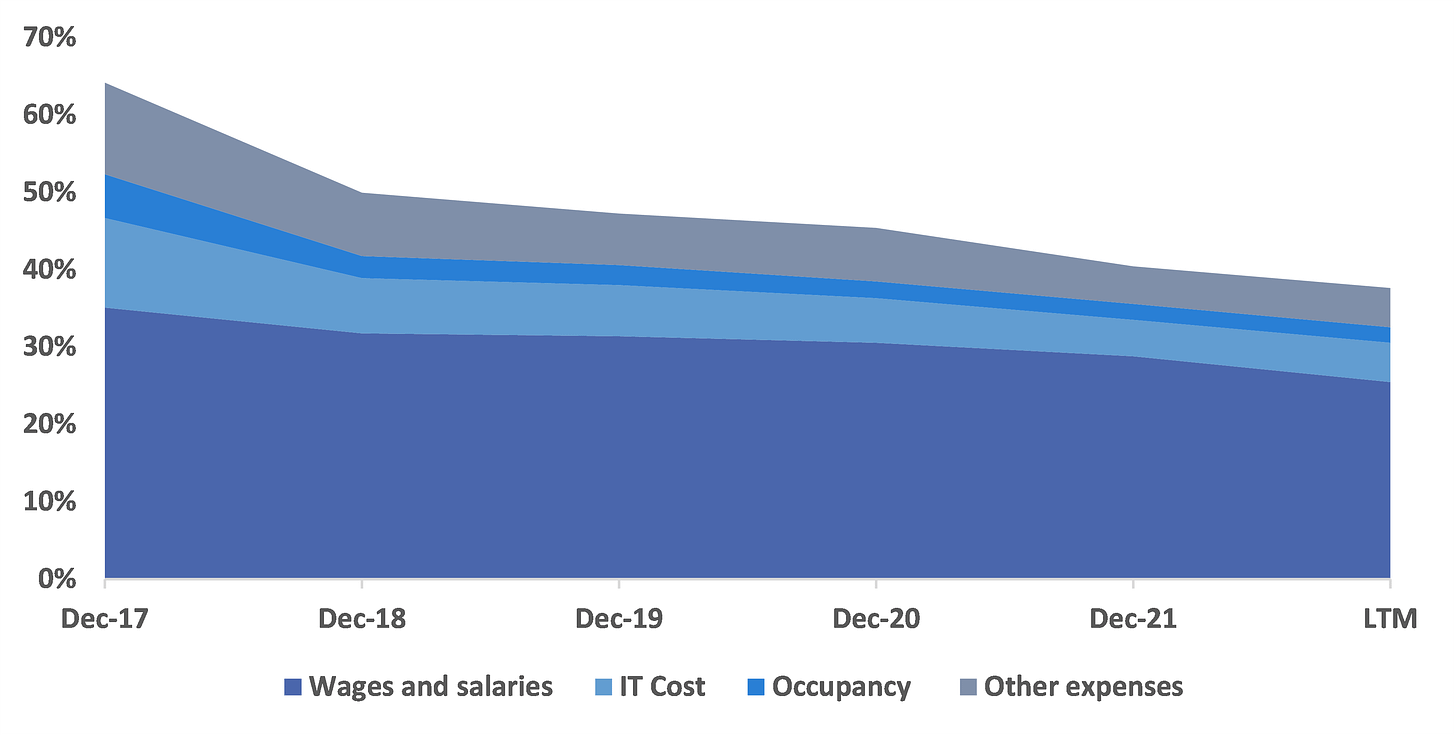
ISC’s biggest operating expense is the wages and salaries of its 400 employees. It is evident that ISC’s management has kept the wages and salaries cost in check while growing the company at a healthy rate. Between 2017 and LTM, ISC’s revenue doubled from $93.6 million to $188.0 million. However, the wages and salaries cost only grew from $33 million (35% of revenue) to $48 million (25% of revenue).
Approximately 28 per cent of ISC’s employees are unionized under the Saskatchewan Government and General Employees’ Union.
Figure 22: ISC Wages and Salaries Cost
ii. COGS
The COGS expense of ISC relates to the provision of government-related services and has been increasing in line with revenue. The COGS increased substantially in 2018 with the acquisition of AVS Systems. For the period 2018 to 2021 COGS averaged about 23% of revenue.
iii. Other expenses
The other main expenses of ISC include IT costs and occupancy costs. Both of which have been trending downward while the company has been growing. IT costs are down from 12% of revenue in 2017 to 5% in the LTM period. Occupancy costs are down from 6% of revenue in 2017 to 2% in 2021 (partly driven by IFRS-16 accounting change). The management of ISC deserves full credit for excellent cost management. Even with multiple acquisitions and a difficult inflationary environment, management has run a tight ship in terms of hiring and expenses.
3. EBITDA
ISC’s reported EBITDA increased from $30.0 million in 2017 to $67.7 for the LTM period. Reported EBITDA margin was 32% in 2017 and 36% in the LTM period. While EBITDA seems to be increasing in line with revenue, it is important to understand the source of the increase in EBITDA. The Registry Operations segment makes up the majority of ISC’s EBITDA even though the contribution has decreased from 93% in 2017 to 71% during the LTM period. While the Registry Operations segment’s contribution to revenue is down to 48%, it still contributed more than 70% to the reported EBITDA of ISC (even with corporate expenses fully allocated to Registry Operations) in the LTM period.
Figure 23: ISC EBITDA Composition
ISC’s adjusted EBITDA, which includes a deduction for share-based compensation and an IFRS adjustment for cash lease cost, increased from $32.0 million in 2017 to $67.0 for the LTM period. Adjusted EBITDA margin was 34% in 2017 and 36% in the LTM period.
4. Working Capital and Capital Expenditures
ISC has always maintained negative debt-free cash-free working capital. The business model does not generally require a high level of accounts receivables. The business also required minimal maintenance capital expenditures on PP&E and intangibles which have ranged between 1% to 2% of revenue over the last 5 years.
5. Return on Invested Capital
ISC’s return on invested capital has been impressively over 30% in the last 5 years. Although these returns are largely driven by the legacy Registry Operations business.
Figure 24: ISC Return on Invested Capital
Return on Invested Capital = Free cash flow / Average Invested Capital
Invested Capital = PP&E + Net Working Capital + Intangible Assets + Goodwill + ROU Assets
H. Management
Shawn Peters, CEO
Shawn Peters joined ISC in 2012 as Vice President, Finance & Technology and Chief Financial Officer and was appointed President & Chief Executive Officer in 2022. He had been the CFO of ISC since its IPO and was involved in the acquisitions completed by ISC since 2015. Prior to ISC, he spent several years with Group Medical Services, where he served as Senior Vice-President and Chief Financial Officer. Mr. Peters holds a Bachelor of Commerce from the University of Saskatchewan and a Chartered Professional Accountant designation.
You can read about other members of the ISC management here.
1. Capital Allocation
No external equity issuance and buybacks
The company has not issued any equity to external investors since the IPO. The company has also not conducted any buybacks since being listed. However, given the current attractive valuation levels at which ISC trades, I hope the management considers doing buybacks in the near future (See section on Valuation).
Conservative use of debt for acquisitions
The company has also been very conservative with the use of debt, only using it for acquisitions. Even with the recent debt increase with the relatively larger acquisitions of Paragon and Reamined, the debt level as of September 30, 2022, is only at 1.1x LTM EBITDA.
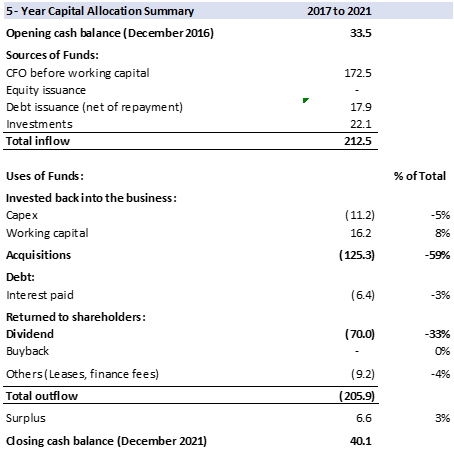
Figure 25: 5-year Capital Allocation Summary
Two main uses of capital – Dividends and Acquisitions
Between 2017 and 2021, ISC has mainly allocated capital towards two main uses, dividends, and acquisitions. Of the $212.5 million of cash inflow generated by the company, $125 million (59%) was allocated toward acquisitions. Another $70 million (33%) was allocated toward dividends.
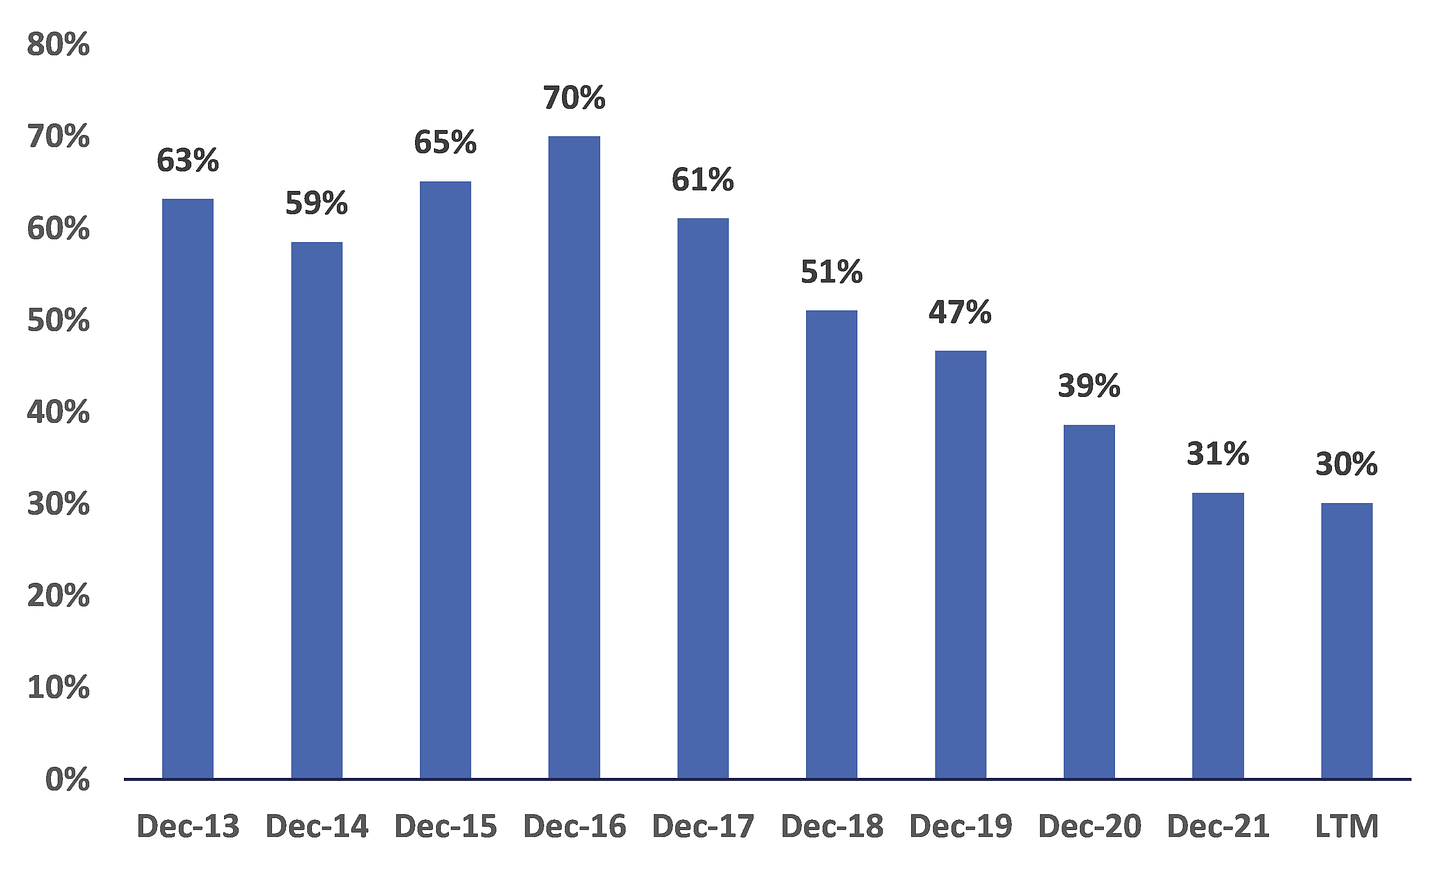
Note that ISC inherited a high dividend from its time of being a crown corporation. To the credit of ISC’s management, it has not reduced the dividend amount but by increasing the overall free cash flow, decreased the payout ratio from 60-70% of FCFF before 2016 to 30% in the LTM period. The management increased dividends for the first time since its IPO in 2021 by 15%.
Figure 26: ISC Dividend Payout Ratio (Dividend / FCFF)
I discussed ISC’s capital allocation towards acquisitions in more detail in Section D. However, it might be good to summarize its acquisition here as well.
Figure 27: ISC Acquisitions
Have acquisitions created value?
Taking all acquisitions, other than Reamined Systems, ISC has spent close to $165 million on acquisitions in the Services Segment and Technology Solutions. The combined EBITDA of the Services and Technology Solutions segments for the LTM period was $20 million. That translates to a return on capital of 12%. Note that 12% is before taxes and any allocated of corporate expenses which would bring the return further down. While most acquisitions done by ISC made sense on paper, the returns from acquisitions for ISC have been average at best.
2. Cost Management
As mentioned before, ISC’s management has done a commendable job at cost management. While amid seven integrations and a challenging inflationary environment, the management has kept wages in check, and other costs such as IT and occupancy have been decreasing as a percentage of revenue.
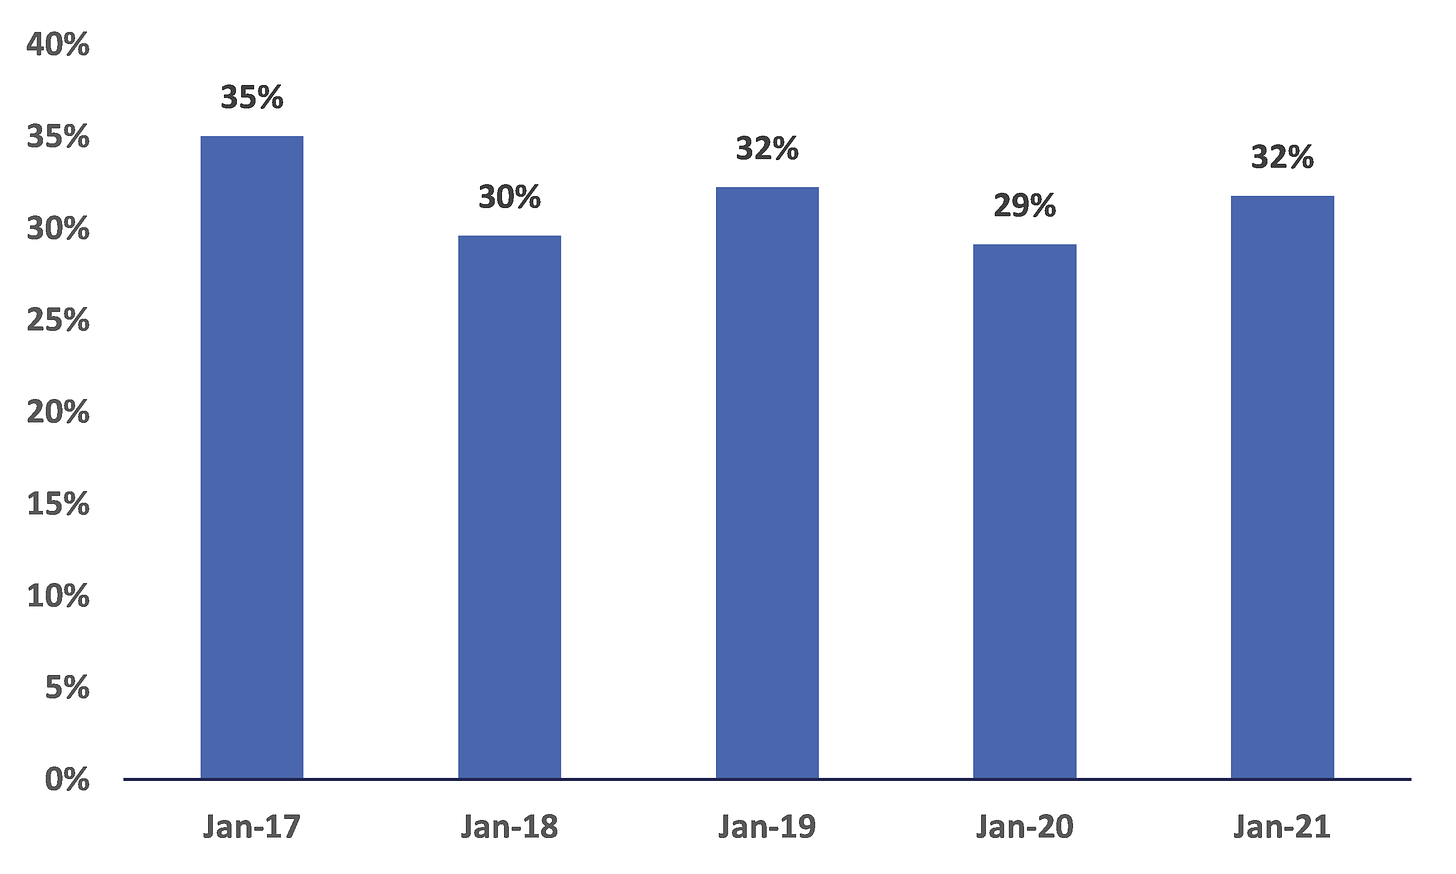
Figure 28: ISC Costs as % of Revenue
3. Performance Guidance
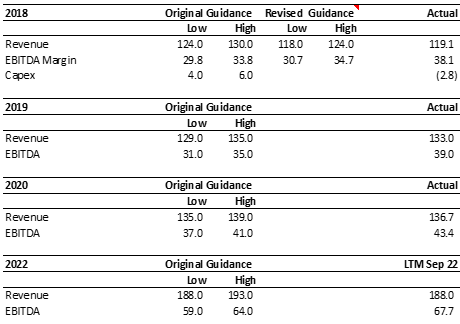
ISC’s management guidance has been conservative in the past. Out of the 4 years when they have issued guidance, only once they have revised it downward, and that too not by a big margin.
Figure 29: ISC Management Guidance Vs. Actual
4. Ownership and Compensation
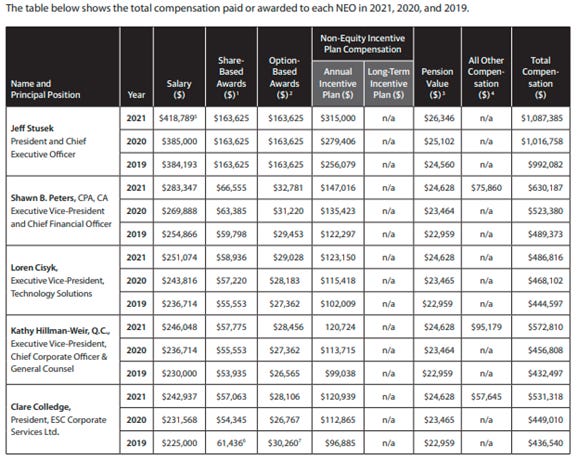
In addition to the base salary, the ISC executives are entitled to short-term incentive compensation which is 60% based on corporate performance goals and 40% on individual performance.
The corporate performance measures are based on the following:
I think corporate performance measures around EBITDA and free cash flow make management better aligned with shareholders than measures such as revenue.
Figure 30: Compensation Table
Note that Jeff Stusek is the ex-CEO of ISC who retired in early 2022.
Shawn Peters currently only holds 10,000 shares of ISC. However, he has unexercised options on close to 331K shares, making his fully diluted ownership close to 2% of ISC.
5. Culture
As per Glassdoor, the ratings for ESC and ERS are much better than ISC. However, the tenure of employees (as per LinkedIn) at ISC is higher as compared to ESC and ERS. 28% of ISC’s employees are unionized.
I. Shareholding and Role of Government
Other major shareholders of ISC as of March 2023 are as follows:
Figure 31: Major Shareholders
Golden Share
The Crown Investments Corporation of Saskatchewan also holds one ‘Golden Share’ of ISC. The Golden Share has certain voting rights and obligations including regarding the location of the head office and the sale of certain of the assets of the Company. It receives no dividend. The Golden Share gives veto power to the Saskatchewan government in relation to:
a transfer of the Company’s registered office outside of Saskatchewan;
a transfer of all or any part of the Company’s head office operations, outside of Saskatchewan;
the sale, lease, or exchange of all or substantially all of the Company’s property;
J. Valuation
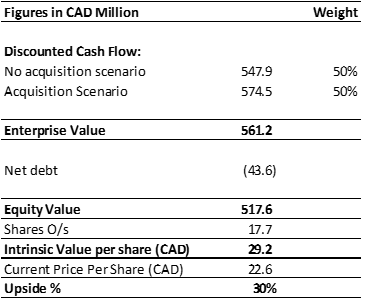
To compute the intrinsic value of ISC, I use a discounted cash flow model. Based on a 10% discount rate and a 2% long-term growth rate, the estimated intrinsic value of ISC is around $29 per share, which represents an upside of 30% from the current market price of $22.6 (as of March 10, 2023).
The intrinsic value estimate is based on the average of two scenarios of discounted cash flow. In the first scenario, ISC only grows organically without acquisitions and at a very conservative rate. In the second scenario, ISC spends $20 million annually on acquisitions for the next 5 years. (See Section M)
Figure 32: Intrinsic Value Estimate (March 10, 2023)
Key Assumptions:
No acquisitions scenario:
Revenue grows at an organic CAGR of 4% from $188 million in the LTM period to $225 million in 2027.
EBITDA margin decreases from 35.6% in the LTM period to 31% in 2027 as the Services Segment grows to become a bigger percentage of ISC’s revenue.
Maintenance capital expenditures of 1% to 1.5% of revenue
Working capital levels gradually increase to 1% of revenue.
Additional assumptions in Acquisition Scenario:
$20 million spent on acquisitions each year
Companies acquired at an average EV / EBITDA multiple of 8x.
Target companies have EBITDA margins of 25%
With acquisitions, ISC’s revenue grows from $188 million in the LTM period to $275 million in 2027
EBITDA margin decreases to 30% in 2027 as acquisitions have lower margins than Registry Operations
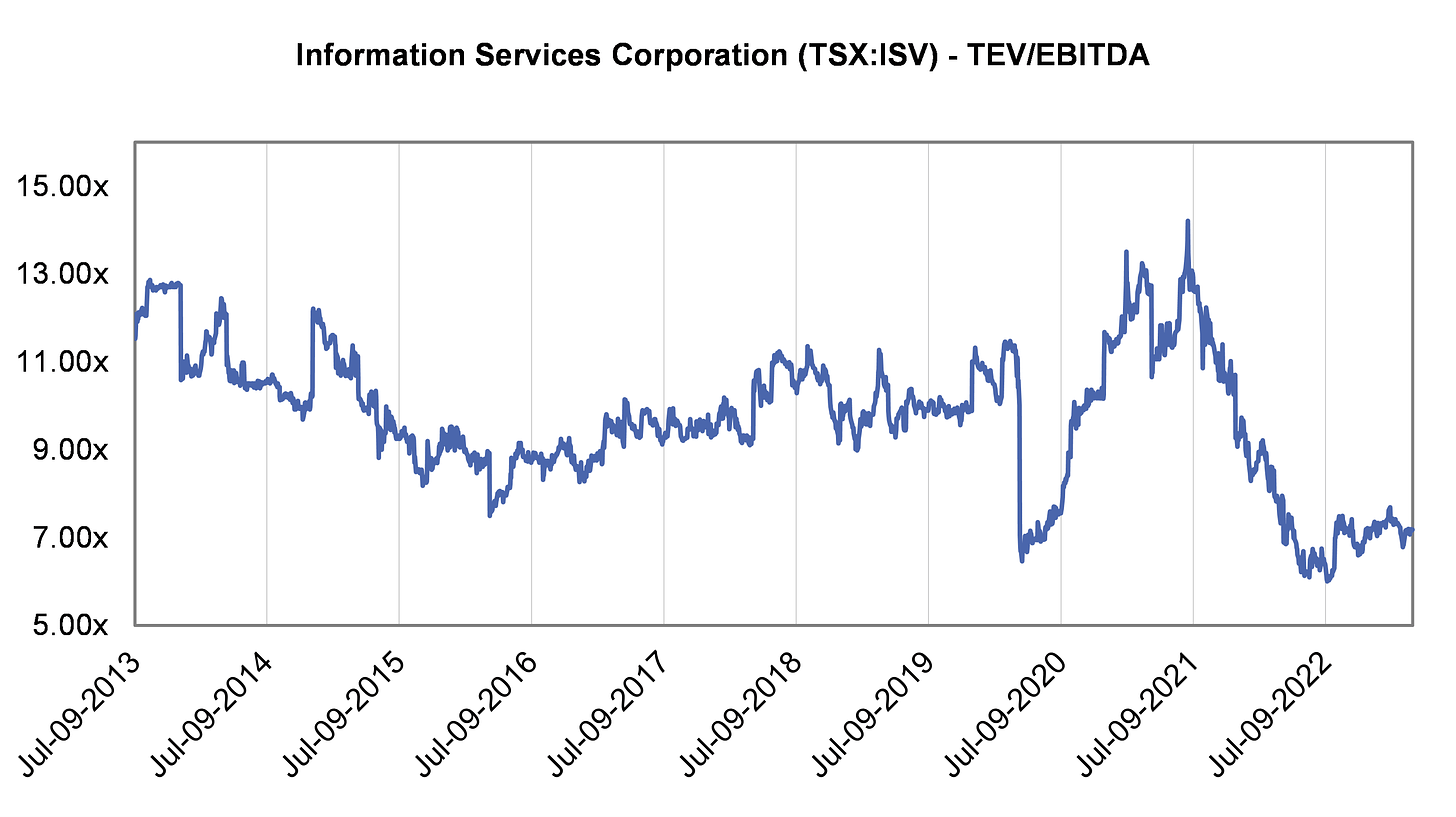
Figure 33: Historical Valuation Levels (EV / EBITDA)
The current valuation levels are also one of the most attractive (read lowest) in terms of EV / EBITDA multiple since ISC went listed in 2013. My intrinsic value estimate of $29 implies an EV / EBITDA multiple of 8.4x, as compared to the currently traded multiple of 6.6x.
K. Risks
Saskatchewan MSA Renewal in 2033
One major risk is whether the 20-year MSA for registry services will be renewed in 2033. I think the risk will always be there, however, it is mitigation to an extent by the fact that Saskatchewan Government still holds a 30% equity interest in ISC and the golden share.
Customer Concentration
There is a small customer concentration in Registry Operations and Services Segment. Risk is mitigated in Registry Operations because ISC is the only provider. In Services Segment, the risk is higher as ISC has higher competition.
L. Conclusion
I believe ISC is a stable business with strong cash flow generation and is priced attractively. The Saskatchewan Registry Operations business is a monopoly business with high margins and requires minimal reinvestment. Management has a track record of multiple acquisitions since the IPO and has maintained quarterly dividends since the IPO. With an intrinsic value estimate of $29 per share, ISC presents a 30% upside opportunity.
Detailed discounted cash flow models are in the PDF linked at the beginning of the article.



















Additional thoughts..
I really got a lot out of this analysis. You did a great job of illuminating the financial mechanics of each operation. I have previously spent a lot of time researching this company but you helped me increase my ability to process all the data.
When I look at the financials now it's clear where all the pieces fit and to trace each dollar of revenue, debt, etc as well as how the acquisitions are unfolding.
"While most acquisitions done by ISC made sense on paper, the returns from acquisitions for ISC have been average at best."
That's the crux right there
Some thoughts...
1. The changes in the Ontario Business Registry are having a negative impact on ISV. (ISV has long been aware of these changes and has mitigated the effects by creating more services for their clients)
https://www.crowe.com/ca/crowesoberman/insights/everything-you-need-to-know-about-the-new-ontario-business-registry
2. They have a 200M shelf prospectus in effect, providing them options for larger acquisitions.
3. The contrast with this company and Dye & Durham provides a lot of insight into how to and how not to run a company. The backstory of ISV and Dye & Durham/Matthew Proud is interesting as well, ISV at one time owned 30% of OneMove, which acquired dye & durham and operated it as a subsidiary. ISV acquired ESC which was part of Dye & Durham, ISV sold its 30% share of OneMove to its shareholders..
(Information Services Corporation (TSX: ISV) has sold its 30% interest in Dye & Durham Corporation (D&D) to the other shareholders of D&D for $25 million in cash.
On September 2, 2015, ISC completed a $3.3 million investment in OneMove Technologies Inc., acquiring 30% of the issued and outstanding voting common shares.
Matthew Proud and brother Tyler Proud, through Plantro Ltd., took OneMove Technologies Inc. in 2013.)