TerraVest Industries (TSX: TVK) - Deep Dive
An Undervalued Consolidator
Thanks for being a subscriber to Fairway Research! Today we take a deep dive into TerraVest Industries, a Canadian consolidator of manufacturing business operating in niche markets. This seemingly boring business is one of the best compounders of wealth in the Canadian markets over the last 10 years. We dig into the business, acquisition strategy, financials, management and valuation. With no investor relations or analyst coverage, this report was a challenging one to write. I hope you like the effort. Below is a Google Drive link to a downloadable PDF of the report (which I firmly believe is a better way to read this long report - get your iPad and coffee and dig in). To give you a sense of the work that has gone into the report, and also give you the flexibility to play around with valuation assumptions, I’ve made my financial model downloadable below.
Summary:
TerraVest Industries Inc. (TSX: TVK) is a Canada based serial acquirer of manufacturing business. It is often the top three player within the niche markets it operates in.
Over the past decade, TerraVest has created tremendous wealth for its shareholders through superior capital allocation. $100 invested in TerraVest as of September 30, 2017, turned into $286 as of September 30, 2022, at an annual return of just over 23% (as compared to $137 for the TSX Composite Index at a rate of 6.5%).
TerraVest does not have an active investor relations function and has no analyst coverage. Supplementary information such as company presentations are also hard to find. Thus, the broader investing community has largely overlooked the company.
TerraVest divides its business into three operating segments. The largest segment is Fuel Containment which it contributes 57% of total revenue and is not dependent on oil and gas activity. The other two segments, Processing Equipment (28% of revenue) and Services (16% of revenue) are dependent on oil and gas activity.
Between FY2014 and FY2022 TerraVest acquired 14 companies by paying low single digit EBITDA multiples for its acquisitions. These are generally niche manufacturing business which either have no succession plan or are in distress. By paying reasonable acquisition prices and through the realization of post-acquisition synergies, TerraVest can generally achieve returns of investment of ~17% on its acquisitions. It further boosts returns by financing these acquisitions through debt.
TerraVest’s revenue has grown from $270 million in FY2018 to $577 million in FY2022 at a CAGR of 21%. Even with the challenges posed by the pandemic, TerraVest was able to maintain average EBITDA margins of ~14%. Further, despite being an asset heavy business, TerraVest has maintained returns on invested capital ranging between 14% and 17%.
TerraVest’s management has a great capital allocation track record. In addition to opportunistically acquiring niche businesses, the management has returned significant amount of capital to shareholders in form of share buybacks.
My discounted cash flow model indicates that TerraVest’s current share price is close to the intrinsic value of its current business (“As-Is” TerraVest). This means that the market is ascribing no value to growth through future acquisitions and the commendable capital allocation record of TerraVest’s management.
Based on the above, I conclude that there is significant upside potential in TerraVest’s stock for the long-term shareholder.
Disclaimer: Fairway Research is currently long TerraVest shares. This report is only for educational purposes and is not meant to be investment advice. Readers should do their own due diligence before investing.
A. Introduction
TerraVest Industries (“TerraVest”) is a diversified manufacturer and consolidator of sophisticated steel and related products such as tanks for storage of heating oil, containers for transport for compressed gases and well head equipment. The company also provides certain specialised services to the oil and gas industry. TerraVest is often the #1 or #2 player in a niche infrastructure market.
Because of the niche characteristics of the industries TerraVest operates in, it can acquire smaller companies at reasonable valuations and roll them up into the TerraVest umbrella of brands. TerraVest is a case study of a disciplined acquisition strategy coupled with good capital allocation leading to consistent increase in shareholder value.
TerraVest had last twelve-month (“LTM”) revenues of $623 million as of December 2022. As of February 17, 2023, TerraVest had a market capitalisation of $478 million and an enterprise value of $700 million. All figures in this report are Canadian dollars unless otherwise stated.
Note that TerraVest is not an exciting business by any means and while I was stretching my circle of competence at times, I have tried to break down the business in a structured format. Unfortunately, the company has no investor relations website. Hardly any investor presentations. No analyst coverage or conference call transcripts. Disclosures in the annual financials also tend to be limited. This is often cited as one of the reasons that TerraVest is not widely known in investing circles even after generated tremendous wealth for its shareholders. TerraVest is often featured in most ‘consistent compounder’ lists of Canadian stocks. Let us dig into this M&A Machine.
B. Brief history of TerraVest
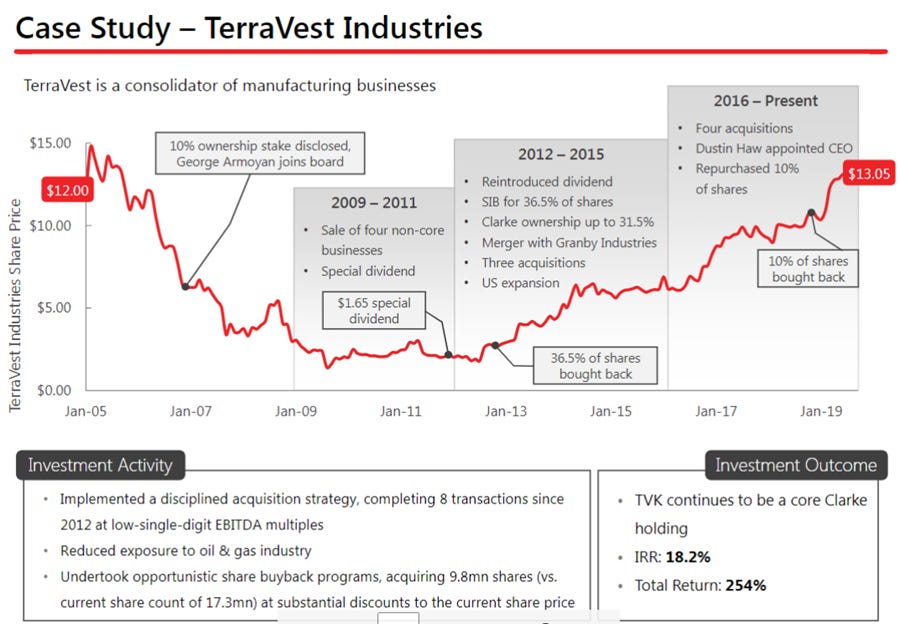
The current TerraVest is vastly different from the company it was 10 years back. Starting in 2011, the company divested several underperforming businesses, and beginning in 2013, TerraVest started acquiring companies which had presence in niche industrial manufacturing sectors. Clarke Inc., which first invested in TerraVest in 2007, was the main activist shareholder during the turnaround period, and the investment faired very well for them with an IRR of 18% and a total return of 254% over its holding period up to 2019. As per Clarke Inc., prior to its involvement, TerraVest was a “broken income trust with a disparate collection of underperforming portfolio companies”. TerraVest reduced its exposure to the oil and gas industry by acquiring niche manufacturers in sectors unaffected by oil and gas cyclicality. TerraVest currently operates through a network of 24 subsidiary companies and has over 1650 employees. Its operations are primarily based in Canada and the U.S.
C. Understanding TerraVest’s business
TerraVest’s business is divided into three main operating segments as highlighted in Figure 2 below. The largest segment is Fuel Containment, it contributes 57% of total revenue and is not dependent on oil and gas activity. The other two segments, Processing Equipment (28% of revenue) and Services (16% of revenue) are dependent on oil and gas activity. In Q1 FY2023 TerraVest replaced the Fuel Containment segment with HVAC Equipment and Compressed Gas Equipment segments.
1. Fuel Containment Segment
The fuel containment segment is the largest segment within TerraVest. The segment is:
#1 manufacturer of home heating oil products in North America.
#1 manufacturer of propane, anhydrous ammonia (“NH3”) and natural gas liquids (“NGL”) transport vehicles and storage vessels in Canada and top two in the U.S.
TerraVest’s fuel containment segment operates through a network of six warehouses and 10 manufacturing facilities spread across Eastern Canada and the U.S. The segment has 933 employees of which 232 are unionized.
The fuel containment segment has two main sub-segments, which are, the HVAC equipment sub-segment and the Compressed Gas Equipment sub-segment.
1A. HVAC Equipment Sub Segment
TerraVest’s HVAC equipment sub-segment includes products such as home heating oil tanks, furnaces, and commercial fuel tanks. It is a critical supplier to the heating oil markets in North America.
Certain areas in Canada, in particular remote communities in the Canadian territories and rural areas across the provinces, do not have direct access to infrastructure that would enable home heating, such as an electrical grid or pipeline network. This means, they can only use heating sources that can be delivered without any “hard” tie ins to their home – making petroleum fuels like heating oil, diesel, and propane absolutely essential. Natural Resources Canada estimates that nearly three quarters of our 250 remote communities use heating oil or propane for home heating.
Prince Edward Island is the top region by household heating oil consumption in Canada. As of 2019, household heating oil consumption in Prince Edward Island accounted for 20% of Canada's household heating oil consumption. Along with 4 other regions (Ontario, Nova Scotia, Newfoundland and Labrador, and New Brunswick) it accounted for 86% of total heating oil consumption in Canada.
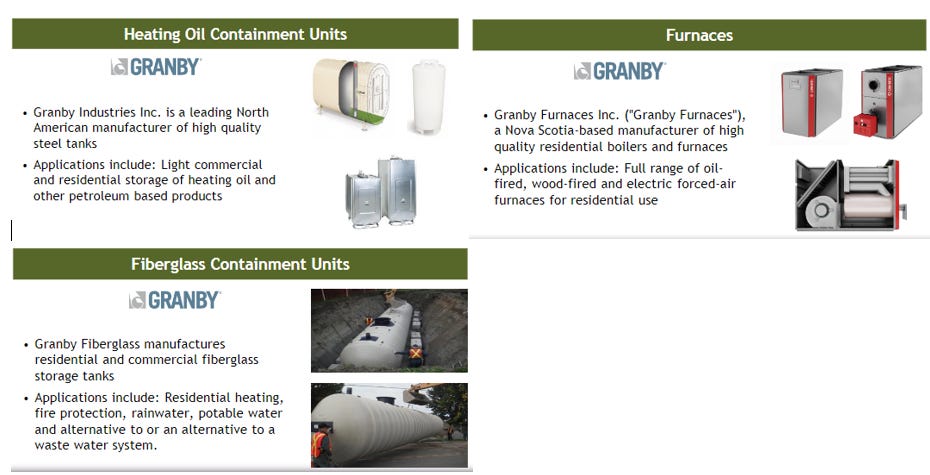
TerraVest’s facilities are strategically located in the eastern Canada which is, as mentioned above, the largest heating oil consumption market. The main brand under which TerraVest sells heating oil tanks and related products is ‘Granby’.
In FY2021 TerraVest further expanded its HVAC Equipment sub-segment by acquiring ECR International, which sells its products under a family of eight well established brand names, including the Dunkirk and Utica boiler brands, and has a 10%+ market share in the North American residential boiler market.
1B. Compressed Gas Equipment Subsegment
TerraVest is the only manufacturer of LPG / NH3 / NGL storage and transport equipment with a national footprint in Canada.
TerraVest’s has 3 main brands which manufacture large propane containment vessels (pro par), assemble propane transport trucks (Signature Truck) and refurbish domestic tanks (Fischer Tanks). To get further colour on TerraVest’s Compressed Gas Equipment Segment watch this video:
Fuel Containment Segment Performance
The Fuel Containment segment of TerraVest has grown from $143 million in revenue in FY2018 to $328 million in FY2022 at a compounded annual growth rate (“CAGR”) of 23%. The growth has been fueled primarily by two big acquisitions, that is, Mississippi Tank and Manufacturing Company in FY2022 and ECR International Inc. near the end of FY2021. Accordingly, there was significant jump in Fuel Containment revenue in FY2022 as can be seen in Figure 3. These two acquisitions and the rise in global steel prices had a meaningful impact on the EBITDA margin of segment which decreased from 26% in FY2021 to 17% in FY2022. However, since TerraVest will likely realise synergies from these acquisitions going forward this margin can improve. Note that based on the limited information disclosed in Q1 FY2023, the HVAC Equipment Subsegment has higher EBITDA margins than Compressed Gas Equipment Subsegment.
2. Processing Equipment Segment
The processing equipment segment is the second largest segment within TerraVest.
TerraVest is the #1 player in wellhead processing equipment in Canada and is a critical supplier to large oil and gas producers in North America.
The Processing Equipment segment manufactures and sells equipment such as: wellhead processing equipment and tanks, wellhead de-sanding units, central facilities processing equipment, natural gas liquids (“NGL”) and LPG storage tanks, anhydrous ammonia storage tanks. The segment markets its products to oil and gas producers, midstream companies, engineering companies, propane distributors, fertilizer distributors and transportation companies. TerraVest sells the products in this segment under the Maxfield, Argo, NWP, Segretech and Environvault brands.
The segment conducts operations through seven subsidiaries with nine manufacturing facilities which are primarily located in Alberta and one facility located in Iowa. The segment has 423 employees out of which 49 are unionized.
Processing Equipment Segment Performance
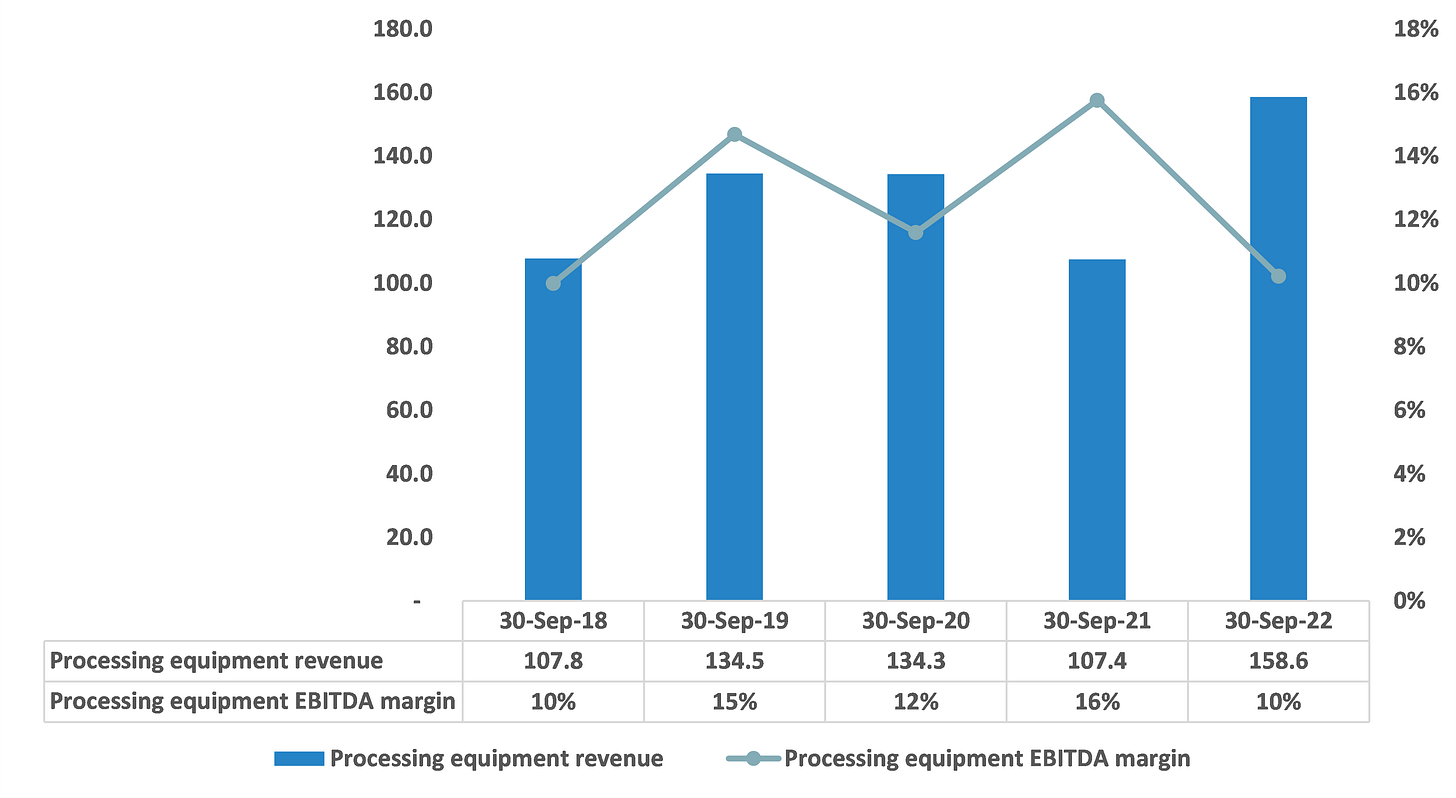
The revenue of the processing segment has been volatile over the past 5 years. Even after acquiring two new companies during FY2019 and FY2020, the revenue of the segment fell in FY2021. This was primarily attributable to a 43% decrease in organic revenue during FY2020 due to weak energy processing equipment demand. The demand was primarily impacted by Covid-19 and weaker commodity pricing. The future performance of Processing Equipment segment will also vary with the capex cycle of oil & gas players. The forecast of oil and gas capex in Alberta is expected to be relatively flat up to FY2031. However, TerraVest might be looking to opportunistically acquire companies to further expand market share.
3. Services Segment
The services segment is the smallest segment within TerraVest. It provides energy producers within Western Canada with services such as fluid hauling, water management, environmental solutions, heating, rentals and well servicing. Green Energy Services and Fraction Energy Services are the main brands under this segment. The segment also has 21 oil and gas service rigs which generate revenue based on utilization and are provided under the brand name of Diamond Energy Services. The demand for the services segment is also tied to oil and gas production. The segment has 297 employees.
The segment provides its services through two subsidiaries, which is Diamond Energy Services and Green Energy Service. These subsidiaries have a network of six field offices and two operating facilities. The service rigs are located in Saskatchewan (Diamond Energy Services) and other field offices are located in Alberta and Fort St. John, British Columbia (Green Energy Services).
We estimate that, post the acquisition of Green Energy Services, about 80% of revenue from this segment comes from fluid hauling, water management, rentals and environmental solutions. The remaining 20% revenue comes from the service rigs. The performance of the segment primary depends on oil and gas activity in Western Canada which is dependent on oil and gas prices.
The demand for service rigs is generally different than for drilling rigs and is not as directly impacted by the price of oil or gas. Work on existing wells can be more economical when commodity prices are lower because operating costs are not as high, and returns are often more predictable. This means service rigs (operated by Diamond Energy Services) may still be busy when producers aren't otherwise looking to drill new wells. The Canadian Association of Energy Contractors estimates that active rig count in Canada will increase by 15% in 2023 as compared to 2022.
The acquisition of majority stake in Green Energy Services (estimated revenue of ~$75 million) in FY2022 increased the revenue of the service segment from sub $20 million per year to $90 million. Note that, there is small customer concentration risk in the Services Segment as two major customers account for 12% and 11% of revenue.
D. Acquisition Strategy
TerraVest is a serial acquirer and consolidator of smaller companies operating in niche manufacturing markets. Between FY2014 and FY2022 TerraVest acquired 14 companies. Seven of these acquisitions were in Fuel Containment Segment. Five in the Processing Equipment segment and two in Services. We discuss different aspects of TerraVest’s acquisition strategy such as pricing discipline, synergy potential, and financing. Specifically:
TerraVest opportunistically acquires company which don’t have a succession plan in place or are in distress.
TerraVest has been very disciplined in paying around 0.4x to 0.6x revenue multiples for its acquisitions. This allows TerraVest to achieve higher returns on acquisition price post synergies. Synergies mostly relate to procurement and corporate expenses.
Lastly, to augment the returns from acquisitions TerraVest mostly finances them through further debt issuances.
Pricing Discipline
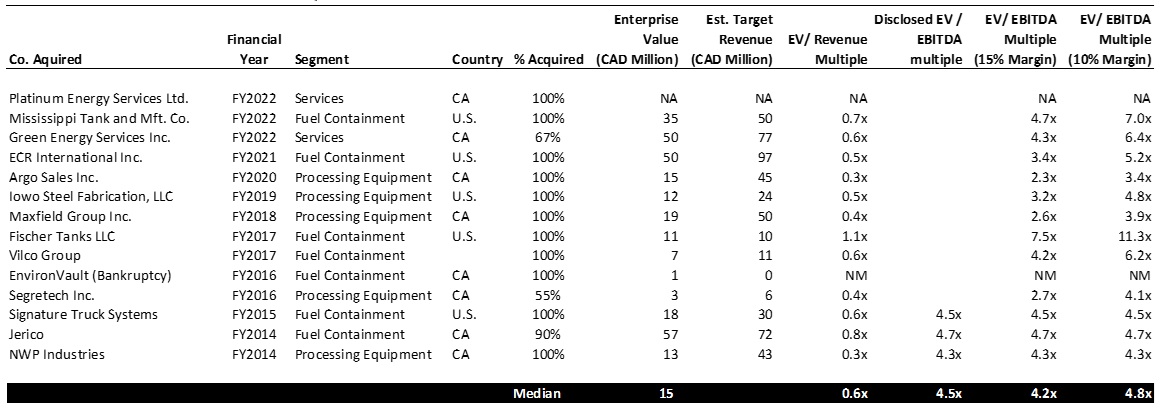
TerraVest has spent over $230 million on acquisitions in the last 9 years with a median deal size of $15 million. It has paid median EV / Revenue multiple of 0.6x revenue. The highest revenue multiple it paid was 1.1x (Fischer Tanks). The EV / Revenue multiples do tend to be slightly higher for larger acquisitions (See Figure 9 below).
While the company does not disclose the financials of the acquired firms (else than the first 3 acquisitions), if we assume a 15% EBITDA margin for the acquired companies, the median implied EV / EBITDA paid by TerraVest is 4.2x. If we conservatively assume a 10% EBITDA margin instead of 15%, the median multiple increases to 4.8x which is also reasonable. Based on this impressive history we can conclude that TerraVest’s management has been extremely disciplined with prices it is willing to pay for targets. This is especially impressive given that it faces competition from middle market PE firms for deals. In such industries is it much easier to acquire companies for reasonable valuation rather than spending capex and time to build the infrastructure and customer relationships. Another reason why these companies are relatively cheap, are because they operate in low growth vertical markets with limited standalone opportunities to expand. However, once the companies are under the TerraVest umbrella, a host of possibilities for cost saving and cross-selling products opens.
TerraVest’s pricing discipline can be attributed to high internal hurdle rates for acquisitions. Hurdle rates are required rates of return from acquisitions. To understand hurdle rates, let’s back calculate the returns which TerraVest can make by paying such low multiples for acquisitions. Assume, TerraVest acquires a company for $50 million (including debt). It pays 0.6x revenue multiple and the target company has 15% EBITDA margins post acquisition. Let us also assume 2% of revenue as maintenance capex. This would give us net operating profit after tax (“NOPAT”) of ~$10 million. So, a return on acquisition price of 17% ($10 NOPAT / $50 Acquisition Price). Note that the 17% ROIC is in line with TerraVest’s own ROIC during the last 5 years. If we conservatively assume 10% EBITDA margins, the return on acquisition price would fall to 11%.
Opportunistic Acquisitions
Over the years, TerraVest’s has made certain smart acquisitions. One example is the recent acquisition of Platinum Energy Services where it paid ~$5 million for the acquisition. However, the business had significant carry forward losses, valued at close to $11 million, which could be set off with TerraVest’s own taxable income to effectively lower the cash taxes of TerraVest. The acquisition would pay for itself within the first year. Another example is its tuck in acquisition of EnviroVault in FY2016 where it bought the company assets under bankruptcy proceedings for only $1 million and is today one of the main brands in the Processing Equipment Segment.
Synergy Potential
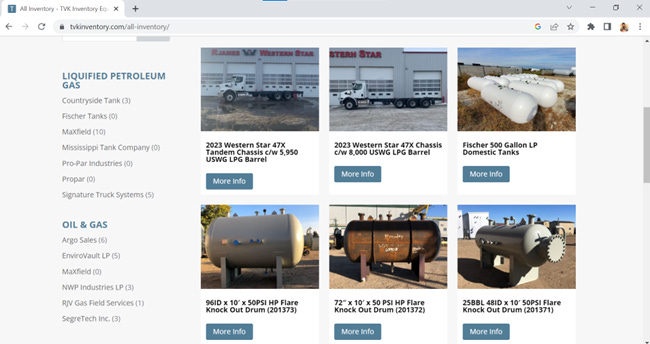
It is important to emphasize that TerraVest gets day-1 synergies from acquired companies in terms of cost functions such as admin, accounting & finance, HR, IT systems, sourcing, and other head office costs by centrally managing these functions. For example, multiple TerraVest subsidiaries in the Processing Equipment Segment share a single sales and corporate office location in Calgary, Alberta. Further, TerraVest is also likely able to source its raw materials such as steel at more favourable rates as compared to smaller manufacturers. TerraVest posts the inventory of its different businesses on its online inventory platform where customers can see which products are currently available. This potentially leads to cross-selling opportunities across TerraVest’s businesses. Lastly, smaller firms do not have the resources to invest in automation of operations and hence miss out on cost savings. However, once the company is under TerraVest’s umbrella it can quickly automate operations. Note that TerraVest has spent close to $45 million on growth capex over the last 5 years (See Figure 24).
Acquisition Financing
TerraVest seems to be financing its acquisitions primarily through debt. This is evident from the significant increase in both acquisition spending and total debt over FY2021 and FY2022. Because TerraVest can service these debt levels at the consolidated level, it can further increase returns from acquisitions by financing them primarily through debt. Of course, this increases the risk as well but cautious use to debt to buy cash flow positive companies is a good strategy if executed well. Note that while the recent increase in debt level might appear concerning, TerraVest’s current Net Debt to EBITDA of 2.5x is significantly lower as compared to the levels of 3.7x seen at the end of FY2021.
E. Historical financial performance
Revenue
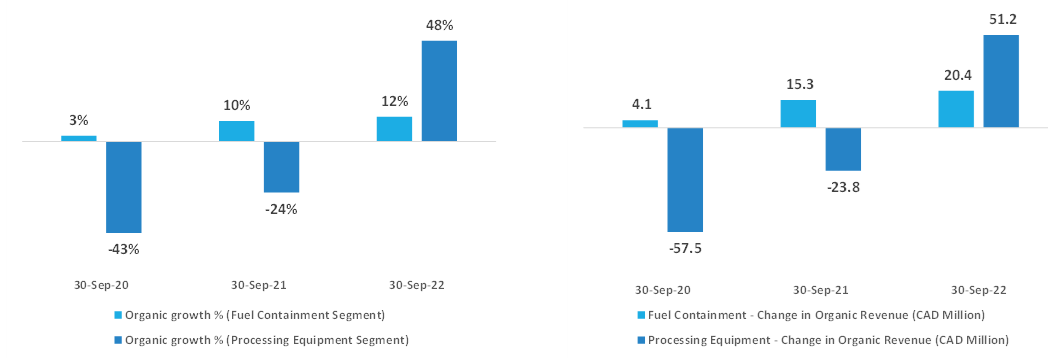
TerraVest’s revenue has grown from $270 million in FY2018 to $577 million in FY2022 at a CAGR of 21%. However, since TerraVest is a serial acquirer, it is important to understand the bifurcation between organic and inorganic revenue growth during this period. Between FY2018 to FY2022, TerraVest made seven acquisitions. As shown in Figure 15 below, majority of TerraVest’s historical revenue growth is attributable acquisitions. Apart from FY2018 and FY2022, organic growth has been flat or negative.
The organic growth for the Fuel Containment Segment has been positive for the last three years. However, the Processing Equipment segment saw significant negative organic growth in FY2020 and FY2021 offsetting the growth of the larger Fuel Containment Segment.
As discussed earlier, the revenue from the Fuel Containment is independent from oil and gas. However, it is sensitive to winter weather and commodity pricing for propane and heating oil. The Processing Equipment revenue is dependent on oil & gas capital expenditure cycles and Services segment revenue depends on oil & gas drilling activity. The general oil & gas capex and opex levels are in effect dependent on oil pricing.
Geographically, slightly more than half the revenue of TerraVest’s revenue comes from Canada and remaining revenue comes from the U.S.
Gross Profits
The cost of goods sold (“COGS”) of TerraVest includes 3 main items, i.e., material costs, personnel expenses, and depreciation. Personnel costs and depreciation comprise about 30% of COGS and the remaining 70% are estimated to be material procurement and other ancillary conversion costs.
TerraVest’s gross profit margins improved from 22.8% in FY2018 to 26.2% in FY2021. However, it fell to 21.6% in FY2022 due to almost 60-80% increase in global steel prices. Steel prices have normalised since then. This is evidenced from the improvement in gross margins for the LTM December 2022 period as compared to FY2022 margins.
Further, note that TerraVest had acquired three large companies towards the end of FY2021 and in FY2022. Accordingly, once TerraVest is able to centralise procurement and get scale benefits in pricing, this gross profit margin might further improve. However, going forward gross profit margins will remain sensitive to global steel pricing cycles.
EBITDA Margins
Administrative and selling costs are the main operating expenses for TerraVest.
Administrative costs have on average been 9.5% of revenue and have grown at the same CAGR (20%) as revenue during FY2018 to FY2022. About half of the administrative costs are comprised of personnel related expenses.
Selling costs have on average been 2.3% of revenue. However, the costs increased to 3.2% of revenue in FY2022 primarily due to increase in personnel expenses within selling. Almost 80% of selling costs are comprised of personnel related expenses.
TerraVest average EBITDA margin over FY2018 to FY2022 have been ~14%. EBITDA margins during the LTM period improved to 14.1%.
Capital Expenditures
TerraVest’s maintenance capex requirements are quite minimal and have on average been 1.5% of revenue. TerraVest also spent ~$45 million over FY2018 to FY2022 on organic growth initiatives.
Working Capital
TerraVest’s business does require significant levels of working capital, usually more than 30% of revenues. Working capital as a % of revenue increased from 30% in FY2020 to 46% in FY2021. While, working capital levels have normalised to an extent by December 2022 (32% of revenue), I understand that the increased working capital as % of revenue in FY2021 was due to two reasons:
Closing of ECR International acquisition in August 2021. This transaction within the Fuel Containment segment was significantly large (~$100 million in revenue) and the FY2021 income statement did not fully reflect the impact of acquisition. However, the balance sheet included all the working capital of ECR International. So to think in terms of Working Capital / Revenue ratio, the numerator fully increased, while the increase in the denominator was muted. The lead to increase in the ratio.
General increase in steel prices which would have increased costs of inventory. As discussed earlier, steel prices have normalised as of December 2022.
Unless TerraVest makes significant acquisitions in the near future, the working capital levels seem to have stabilised.
Return on Invested Capital
During FY2019 to FY2022, TerraVest’s returns on average invested capital, as calculated based on stable unlevered free cash flow have ranged between 14% and 17%. Figure 18 below shows where TerraVest would be placed within the Russel 3000 index which cover 96% of the U.S. equity market.
E. Management performance
Before discussing the specifics of the TerraVest’s management, let us dive into two key factors of determining management performance. These are, TerraVest’s capital allocation over the last 5 years and its share price performance relative to the TSX over the same period. In terms of capital allocation, we will discuss how the management has invested cash flows into the business, returned capital to shareholders, and acquired companies.
Capital Allocation
Figure 19 below includes a detailed breakdown of TerraVest’s capital inflows and outflows over the 5-year period between FY2018 to FY2022. TerraVest’s operations generated cash flow of $225 million. Of this $139 million was reinvested into the business in form of working capital and capex. TerraVest spent another $129 million on acquisitions and investments. $61 million was used to repay debt and $79 million was return to shareholders in form of dividends and share buybacks. The acquisitions specifically make sense because TerraVest can redeploy capital into the business at return on invested capital over 15% (See Figure 14). The deficit in cash flow was funded through raising additional debt of $198 million. As discussed earlier, the increase in debt is primarily to fund acquisitions. If we consider the net increase in debt of $137 million ($198 million – $61 million), it is close to the amount spent on acquisitions ($129 million).
Share Buybacks
TerraVest’s diluted share count has decreased from 20.6 million as of September 2018 to 18.4 million as of September 2022. During the period, TerraVest bought back 3.2 million shares at an average buyback price of $13.2 per share. This is almost half of the current share price of $26.42 (February 17, 2023). It is evident that TerraVest’s buyback programs have created substantial value for its shareholders over time.
Share Price Performance
$100 invested in TerraVest on September 30, 2017, turned into $286 as of September 30, 2022, at a CAGR of 23.4%. While the TSX Composite Index returned only 6.5% over the same period (turning to $137).
Key Management and Governance Team
Charles Pellerin – Chairman
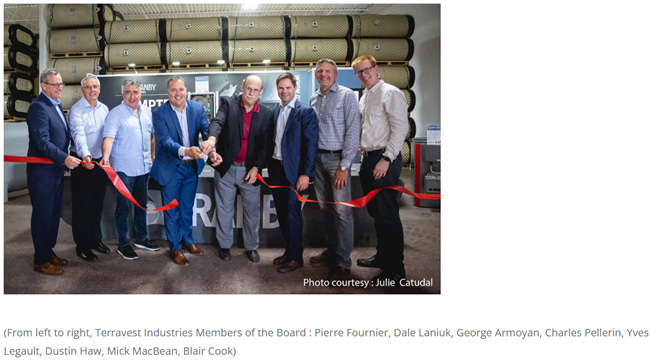
Mr. Pellerin currently owns ~20% of TerraVest. He is the Principal Partner and President of one of the largest independent accounting firms in Quebec, Pellerin Potvin Gagnon S.E.N.C.R.L. Since 2009, Charles has been a board member of Clarke Inc. (TSX: CKI). In addition, he has been the Executive Chairman of TerraVest since 2014, when TerraVest acquired one of Charles’s manufacturing companies (Granby Industries).
Mr. Pellerin holds a bachelor’s degree in accounting from Ottawa University and a post graduate diploma in accounting from University of Trois-Rivieres, Quebec. He has been a member of the Quebec Order of the Chartered Accountants since 2000.
Dr Dustin Haw - CEO
Dr Haw took over as the President and CEO of TerraVest in 2017. Earlier, he served as a director on the board of directors since 2014. He was previously the Vice President of Investments for Clarke Inc. where he led the investment team. Prior to joining Clarke Inc., Dr Haw was an investment analyst at Geosam Capital Inc., a private investment company specializing in small and mid-capitalization companies, with a focus on real estate and industrial investments. Dr Haw holds a B Sc. (2006), PhD in Physics from the University of Western Ontario (2012) and is a CFA Charterholder (2016).
Mitch Gilbert - CIO
Mr. Gilbert joined TerraVest in 2013 with responsibilities in sourcing, negotiating and consummating mergers and acquisitions opportunities as well as evaluating organic growth investments and new market opportunities. Prior to joining TerraVest, Mr. Gilbert was at a National Bank for 14 years in the Mergers & Acquisitions and Diversified Groups. Mr. Gilbert holds an undergraduate degree in Commerce from McMaster University, an MBA from the Ivey School of Business and is a CFA Charterholder.
There are no specific performance targets mentioned in TerraVest’s compensation policy. A committee of the board of directors determines the compensation by its objective to attract and retain executives. I believe this can certainly be improved upon by aligning key management compensation to free cash flow growth. Note that there are no provisions (such as revenue growth targets) which would let the management go on an empire building spree and pursue growth at any cost.
G. Valuation summary
Intrinsic Value of the “as-is” TerraVest
To understand whether TerraVest is undervalued, we need to understand how much value the market is ascribing to the operations in place and the growth opportunities. To compute the intrinsic value of TerraVest “as-in”, I take a simplistic set of assumptions as follows:
TerraVest stops making any new acquisitions and operates the current businesses “as is” for the next 5 years;
2% inflationary annual revenue growth;
14% flat EBITDA margin in line with the historical average;
the current working capital levels are sufficient;
maintenance capex will grow in line with revenue (2% y-o-y growth); and
10% discount rate and 2% long-term growth rate.
As presented in Figure 24 below, after taking the assumptions, the value of the current business of TerraVest is $29.6 per share. This compares to the current share price of $26.4 and implies that the market is currently valuing TerraVest below the intrinsic value of its current in-place business and ascribing no value to the exceptional acquisition and capital allocation history of TerraVest’s management. TerraVest’s acquisition strategy has already yielded superior returns on invested capital and tremendous wealth for its shareholders over the last 9 years. If management continue pursuing its disciplined acquisition strategy, TerraVest will continue to generate incremental shareholder value. Overall, market is clearly undervaluing TerraVest.
H. Risks
M&A Market Conditions and Deal Flow
Market conditions and competition from other acquirers and private equity might prevent TerraVest from completing acquisitions at reasonable valuations. If it must pay higher multiples for transactions, it will reduce the overall return on invested capital. However, there are two main mitigating factors. First, historically TerraVest’s management opted to wait instead of paying a premium to get the deal done. I believe the management will continue to play the wait and see approach. Share buybacks and debt repayment are always good options for capital allocation if acquisition opportunities dry up. The current interest rate environment should deter competition from PE firms. Further, baby-boomer led businesses will be coming up for sale over the next few years as they go into retirement, which should ensure good deal flow for TerraVest.
Operational Risks
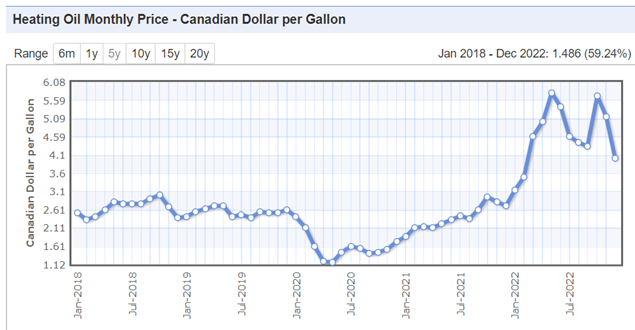
For the HVAC sub-segment, unusually warm winters can result in reduced heating requirements that have a negative impact on the demand for these segment products. Increased costs relating to home heating with oil, including heating oil costs and related home insurance costs, as a percentage of consumers’ disposable income could also be a factor that negatively influences steel tank and/or furnace replacement decisions. Another factor is home resale activity which can be a driver of replacement residential oil tank sales, as homeowners and insurers conduct inspections and identify aging tanks during the purchase and sale process. Reduced activity in the residential home resale market could lead to reduced demand.
As discussed earlier, the Processing Equipment and Services segment are highly dependent on oil and gas capex and opex cycles. Processing Equipment revenue can be quite volatile year on year. Normally, the company's Processing Equipment segment and Services segment tend to be a natural hedge against the Fuel Containment segment with respect to oil & gas prices.
I. Conclusion
At the current share price of $26.4, and an intrinsic value estimate for the “as-is” business of $29.6 per share, TerraVest presents an upside opportunity of ~12%. However, I expect that there will be substantial further upside created through acquisitions and buybacks. I am confident in the management’s ability to keep acquiring 1-2 niche businesses each year at reasonable valuations. I am also cautious of risks relating to oil and gas commodity cycles for the Processing Equipment and Services business segments and challenges it presents for organic growth.
Thank you for reading my deep dive on TerraVest. Please let me know how I could have done better by reaching out to me on Twitter @FairwayResearch.
Disclaimer: This report is only for educational purposes and is not meant to be investment advice. Readers should do their own due diligence before investing.
















Very informative article! I enjoyed reading it, thank you very much.
Thanks for the good write-up.
I believe that ROIC is higher since they are acquiring businesses and therefore goodwill is inflated and earnings lower. If one takes the money used to acquire businesses from 2018 to 2022 and divide the increase in earnings over the same period by it, you'd get 25%. Or am I forgoing the investments in organic growth?
Furthermore, my inability to assess the strong and durability of the businesses under its helm withholds me from investing in it. Idk if you have any further inside into the moats of the businesses?